
Fig. 4.
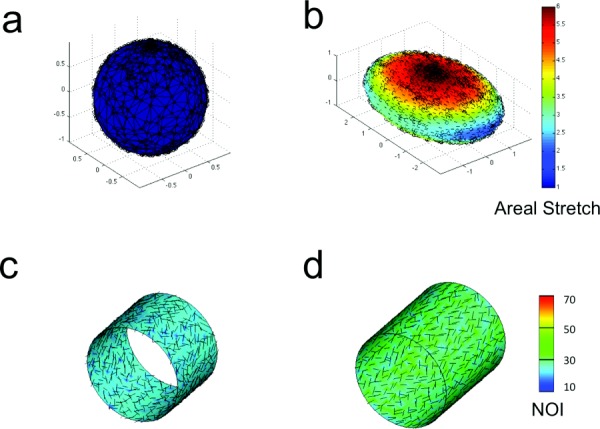
(a) Data points were generated on the surface of a unit sphere using matlab rand function. (b). Areal stretch after extension in x- and y-directions (, , ). Arrows show the direction of the major principal strain. (c) Main fiber direction (arrows) and normalized orientation index (contour plots) in un-deformed configuration. (d) Main fiber direction and normalized orientation index following axial extension ().