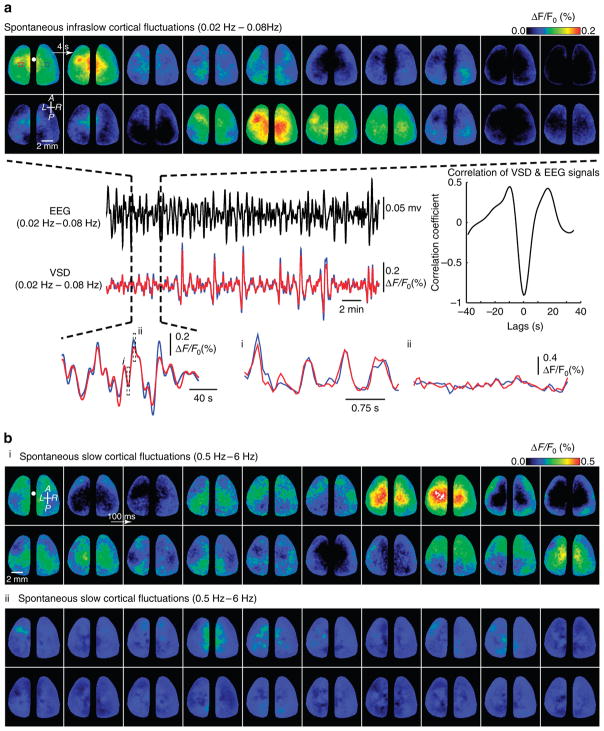
Figure 2. Spatiotemporal characteristics of spontaneous, infraslow fluctuations revealed by voltage-sensitive dye imaging.
(a) Montage of spontaneous, infraslow (0.02–0.08 Hz) bilateral VSD activity in cortex corresponding to the segment of time depicted by the dashed black lines to the EEG signal below. Successive image frames depict 4 s intervals. Blue and red dashed boxes indicate position of ROIs centred on the right (R)- and left (L)-HLS1, respectively. Images in montage have been scaled to the colour bar. Comparison of time courses of simultaneously acquired infraslow VSD signal measured from ROIs from L-HLS1 (blue) and R-HLS1 (red) with the EEG signal (black) of a closely positioned EEG electrode. Cross-correlogram depicting the cross-correlation of EEG and VSD signals. Expansion in time of infraslow VSD signals depicting time course of higher-frequency activity (0.5–6.0 Hz) at two phases of infraslow spontaneous activity (dashed black boxes denoted by i and ii). Compass arrows indicate anterior (A), posterior (P), left (L) and right (R) directions. White circle denotes the position of the bregma. (b) Montage of higher-frequency VSD spontaneous ‘up-down’ state activity (0.5 to 6.0 Hz) taken from a period of peak infraslow activity (a-i) and trough infraslow activity (a-ii). Images have been scaled to the depicted colour bar.

