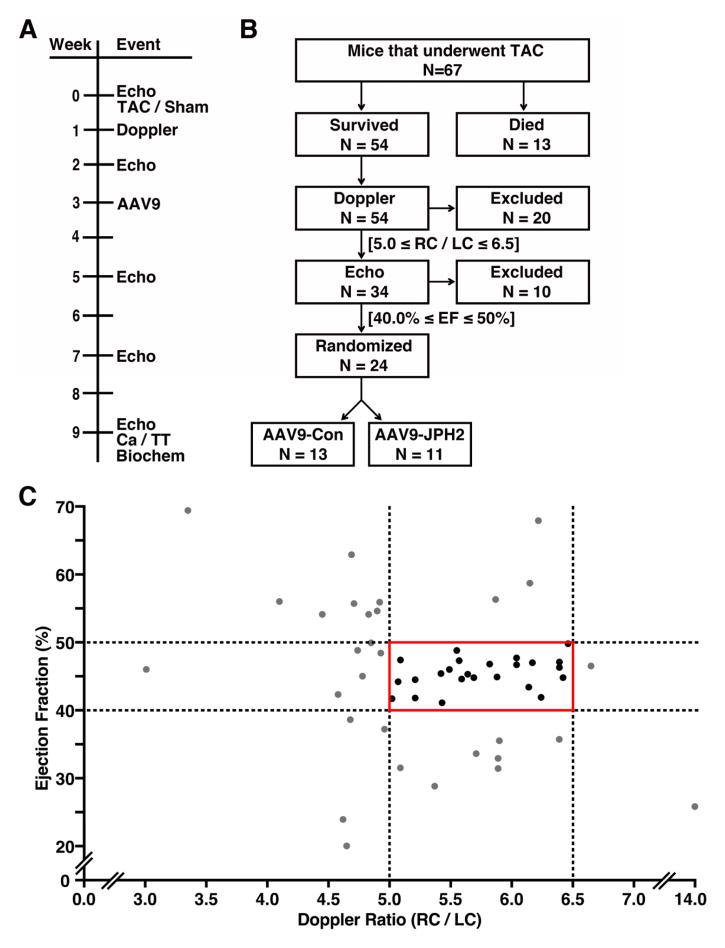
Figure 3.
Study design for gene therapy study in a mouse model of heart failure. (A) Timeline depicting various experimental procedures performed on a cohort of mice subjected to sham or transverse aortic constriction (TAC), and subsequent AAV9 gene therapy. (B) Flow chart of sequential inclusion criteria used to obtain a cohort of mice with similar levels of early stage heart failure that were then randomized to receive AAV9-Con or AAV9-JPH2. Criteria included Doppler ratio of right carotid to left carotid peak velocity (RC/LC) and echocardiographic ejection fraction (EF). (C) Graph showing distribution of individual mouse Doppler ratios at 1-week post-TAC and EF assessed by echo at 2-weeks post TAC. The solid red box denotes the group of mice that were included for randomization. Black dots represent mice included and grey dots denote mice excluded from the trial based on Doppler and echo criteria. N= number mice.

