
Figure 3. MYC/NCOR2/HDAC3 complex repress type I IFN production and signaling in pDC.
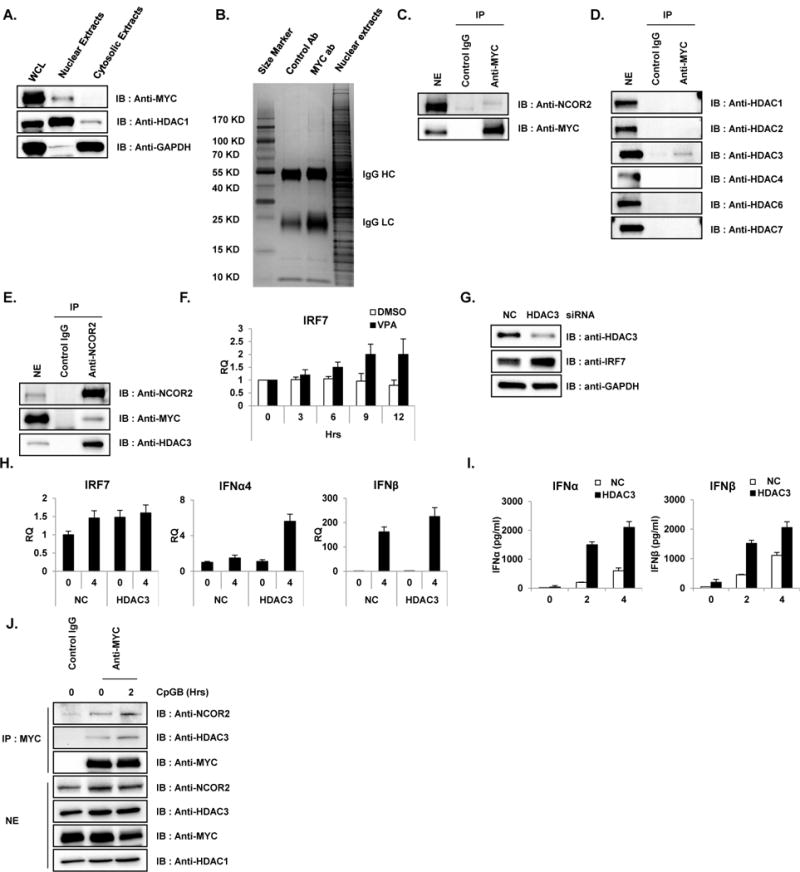
(A) Nuclear fraction of pDC cell line revealed the nuclear localization of MYC. Cytosolic and nuclear fractions from unstimulated GEN2.2 cells were immunoblotted with antibody against MYC, HDAC1 and GAPDH. HDAC1 and GAPDH were used as nuclear and cytosolic markers, respectively. Data are representative of three independent experiments. (B) MYC-bound protein complexes were identified by IP-mass analysis. Unstimulated GEN2.2 cells were lysed and nuclear extracts were fractionated as in A and immunoprecipitated with MYC-specific antibody and rabbit IgG control. Then, immune complexes from MYC- IP were separated on a 4–20% Gradient SDS-PAGE gel (Thermo Scientific) and stained with Coomassie Blue (Sigma). All bands were in-gel digested with trypsin, and proteins were identified by nanoflow LC-MS/MS analysis with a nano-LC1000 (Thermo Scientific) coupled to Thermo ORbitrap Velos™ (Thermo Scientific) mass spectrometer. Acquired MS spectra were processed by BioWorks software to convert data into peptide and protein composition information. (C) Co-immunoprecipitation experiments showed direct interaction of MYC and NCOR2 in unstimulated pDC cell lines. Unstimulated GEN2.2 cells were fractionated for nuclear extracts and co-IPed with anti-MYC antibody and immunoblotted with anti-NCOR2. IP with IgG was used as a control. Data are representative of three independent experiments. (D) MYC interacts with HDAC3. Co-IP experiments showed direct interaction of MYC and HDAC3 in unstimulated pDC cell lines. Unstimulated GEN2.2 cells were fractionated for nuclear extracts, co-IPed with anti-MYC antibody and immunoblotted with anti-HDACs. IP with IgG was used as a control. Data are representative of three independent experiments. (E) Reciprocal co-IP showing endogenous binding of NCOR2, HDAC3 and MYC. Nuclear extracts of GEN2.2 cells were subjected to IP with anti-NCOR2 antibody followed by western blot analysis for NCOR2, MYC and HDAC3. Data are representative of three independent experiments. (F) Pharmaceutical inhibition of HDACs recovered IRF7 expression. GEN2.2 cells were treated with 100 μM of HDAC inhibitor, valproic acid (VPA) and mRNA was measured for IRF7. Primers specific for GAPDH mRNA were used to normalize samples. These data are representative of three independent experiments performed in duplicate. (G) HDAC3 depletion enhanced IRF7 expression in GEN2.2 cells. Cell lysates from GEN2.2 cells transfected with control and HDAC3 siRNAs were analyzed by western blot analysis with antibodies against IRF7, HDAC3 and GAPDH. Data are representative of three independent experiments. (H) HDAC3 depletion enhanced IRF7 expression in GEN2.2 cells. GEN2.2 cells were transfected with control and HDAC3 siRNAs for 48 h, followed by stimulation with CpGB (0.5 μM) for 4 h. IRF7, IFNα4 and IFNβ mRNA were analyzed by qRT-PCR. Primers specific for GAPDH mRNA were used to normalize samples. Data are representative of three independent experiments (average of triplicates ± standard deviation). (I) HDAC3 depletion enhanced type I IFN expression in GEN2.2 cells. A human pDC cell line was transfected with siRNAs against HDAC3 for 48 h followed by stimulation with CpGB (0.5 μM) for 4 h in 96-well culture plates. IFNα and IFNβ production was measured by ELISA. These data are representative of three independent experiments performed in duplicate. (J) MYC interacts with NCOR2 and HDAC3 in GEN2.2 cells stimulated with CpGB. Co-IP experiments showed direct interaction of MYC, NCOR2 and HDAC3 in GEN2.2 cells unstimulated and stimulated with CpGB (0.5 μM) for 2 h. GEN2.2 cells were fractionated for nuclear extracts, co-IPed with anti-MYC antibody and immunoblotted with anti-HDAC3 and NCOR2. IP with IgG was used as a control. Data are representative of three independent experiments.