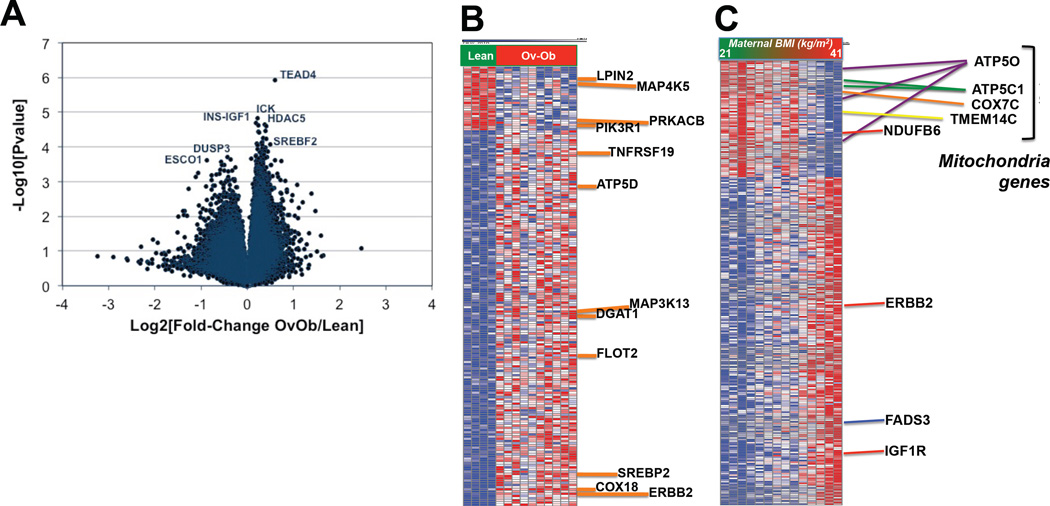
Figure 1. Global gene expression patterns in HUVEC isolated from infants of overweight-obese mothers vs. controls.
A. Volcano plot.
B. Heatmap – top 200 differentially regulated probes, selected based on Comparative Marker Selection scores, GenePattern, Broad Institute.
C. Heatmap of top-ranking probesets correlating with maternal BMI, selected based on Pearson’s R≥0.75 and R≤0.75. The full gene list is available in Supplemental Table 2B.

