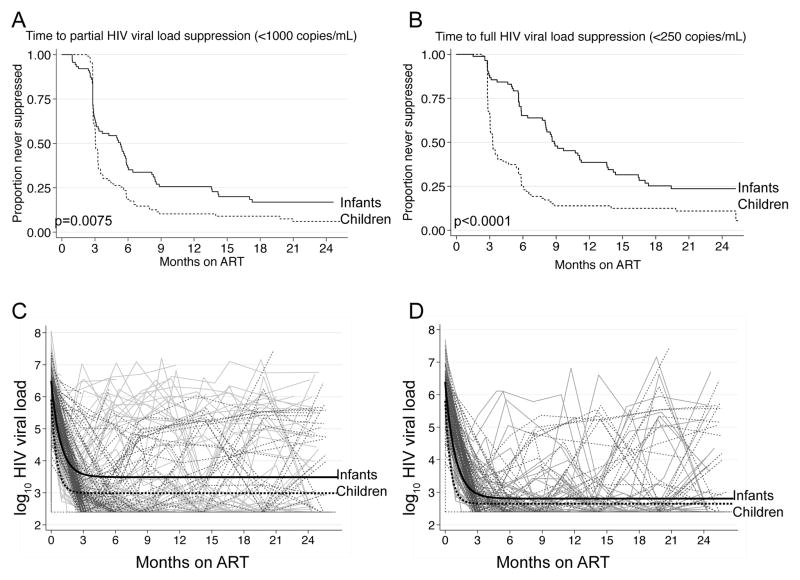
Figure 1.
Viral suppression post-ART in the infant (solid) and child (dashed) cohorts. Panel A shows time to first partial HIV viral load suppression (<1000 copies/mL) and Panel B shows time to first full HIV viral load suppression (<250 copies/mL) after ART initiation in each cohort. P-values are from the log-rank test for equality of survival functions. Panel C shows individual trajectories of log10 HIV viral load in the infant and child cohorts over two years of follow-up, overlaid with the population mean for each cohort. Panel D shows individual trajectories of log10 HIV viral load in the infant and child cohorts, restricted to those who achieved full suppression (<250 copies/mL) at one or more visits, overlaid with the population mean for each cohort.

