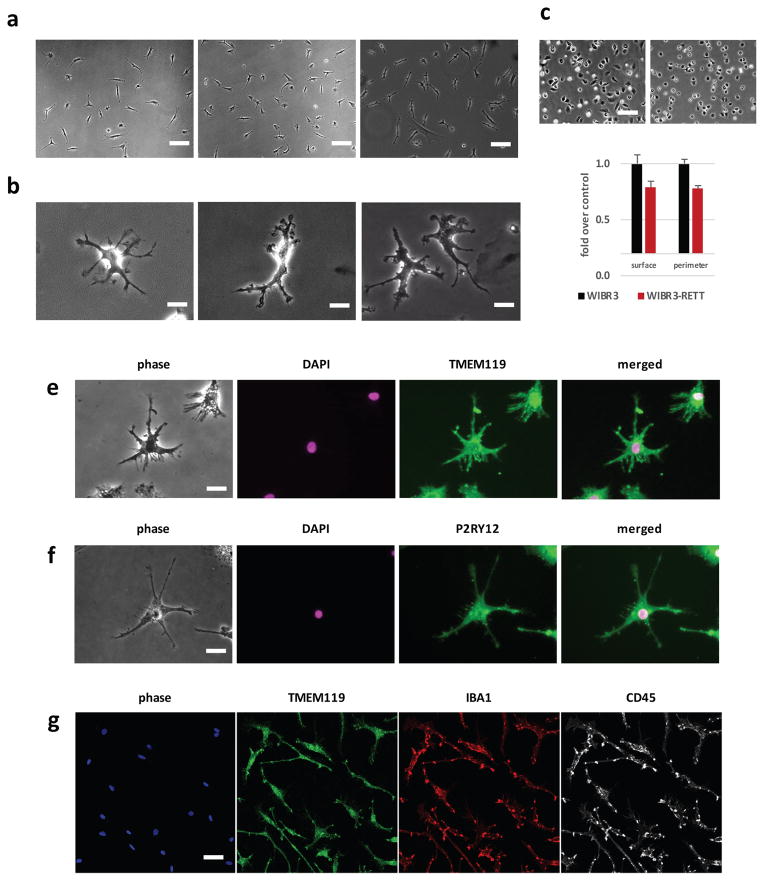
Figure 3. pMGLs adopt ramified morphologies over time and express specific markers of microglia.
(a) example phase contrast images of depicting morphologies of human fetal microglia (hFMG; left) and pMGLs derived from human ES cells (hES pMGLs, middle) or induced pluripotent stem cells (iPS pMGLs, right). Scale bars: 25μm. (b) example high magnification images depicting morphologies of mouse primary neonatal microglia (mNMG, left), hFMG (middle) and hiPS pMGLs (right). scale bars: 10μm. (c) Example of phenotypic output in freshly plated MECP2 mutant (right panel) and isogenic wild-type cells (left panel, scale bar: 25μm). Average cell spread (surface) and perimeter are significantly lower in MECP2 mutant microglia (mean ± s.e.m. for 2 biological replicates, TTEST, p<0.05). (e–f) example images of ramified pMGLs (phase) stained for DAPI (magenta) and either TMEM119 (e, green) or P2RY12 (f, green). Scale bars: 10μm (g) Example confocal image representing an optical slice of wider field-of-view, stained for IBA1 (red), TMEM119 (green) and CD45 (white). Scale bar: 20μm.

