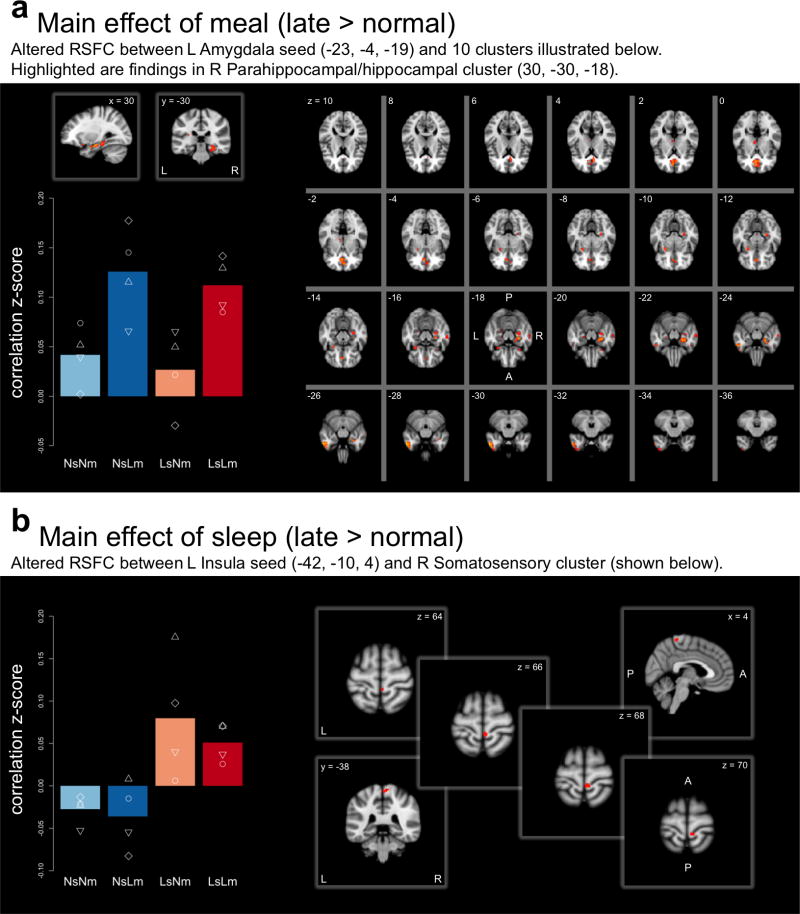
Figure 2.
Seed-based RSFC for A. Left Amygdala seed. Regions showing significant (P<0.005, controlling for FWE) RSFC increase in late > normal meal overlaid on the MNI152 template. Bar graph plots the mean Fisher z-transformed correlation (overlaid white shapes are individual values) between the left Amygdala seed and the cluster peaking at [30, −30, −18; MNI] for each of the 4 conditions normal sleep/normal meal (NsNm), normal sleep/late meal (NsLm), late sleep/normal meal (LsNm), and late sleep/late meal (LsLm). B. Left Insula seed. Regions showing significant (P<0.05, controlling for FWE) RSFC increase in late > normal sleep overlaid on the MNI152 template. Bar graph plots the mean Fisher z-transformed correlation (overlaid white shapes are individual values) between the left Insula seed and the cluster peaking at [4, −38, 64; MNI] for each of the 4 conditions. A = anterior; FEW = family-wise error; L = left; MNI = Montreal Neurological Institute; P = posterior; RSFC = resting-state functional connectivity; R = right

