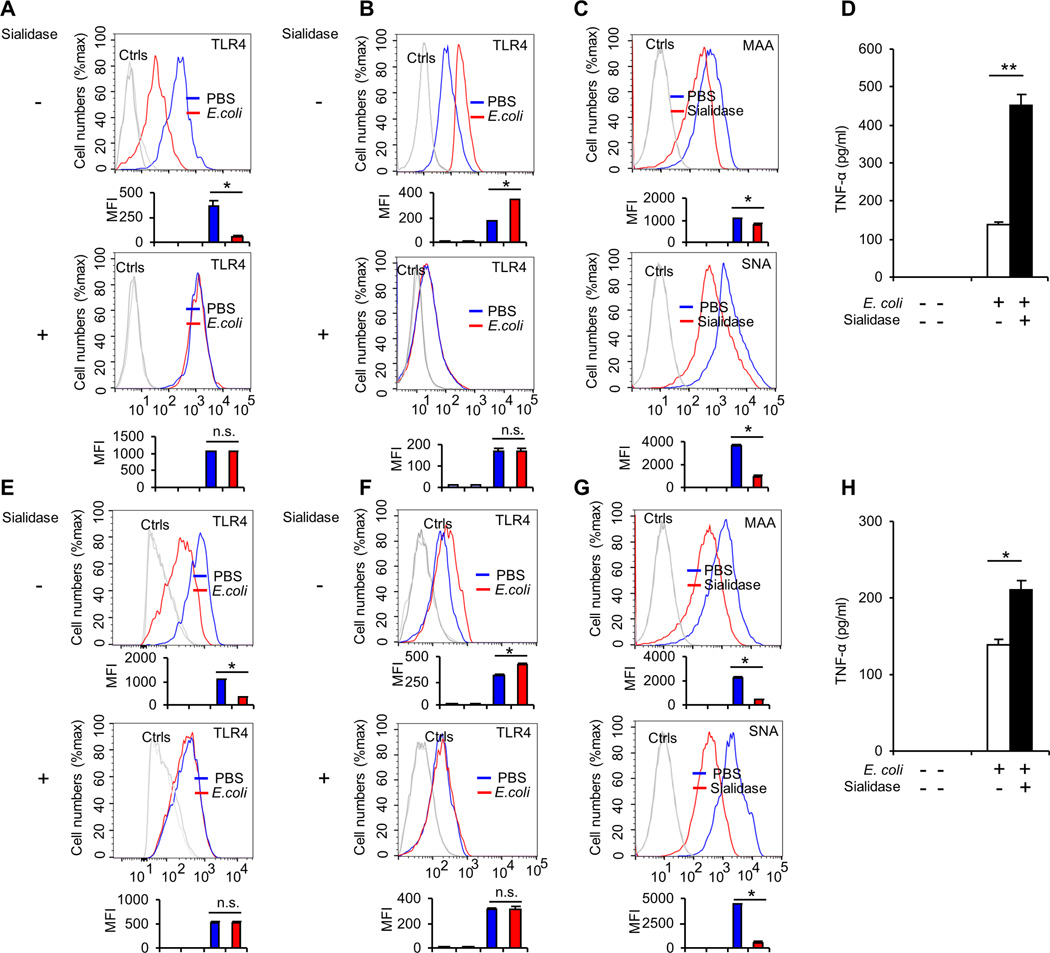
FIGURE 1. The role of sialylation on E. coli-induced TLR4 endocytosis.
Spleen cells from WT C57BL/6J mouse were first treated with sialidase or PBS at 37°C for one hour and then treated with PBS or E. coli 25922 (MOI = 10) at 37°C for one hour. (A) Cell surface levels of TLR4 on dendritic cells (gated with CD11c+) were determined by flow cytometry. (B) Intracellular staining for TLR4 in dendritic cells (gated with CD11c+). (C) Sialidase treatment reduced both α2-3– and α2-6–sialylation of D2SC/1 dendritic cells. Cells were treated as in A, and then stained with MAA or SNA. MAA, fluorescein-Maackia amurensis lectin I, recognizing α2-3–linked terminal sialic acid; SNA, fluorescein-Sambucus nigra (elderberry) bark lectin, recognizing α2-6–linked terminal sialic acid. (D) TNF-α in the cell culture supernatants was analyzed with cytokine bead array. Spleen cells from WT C57BL/6J mouse were first treated with sialidase or PBS at 37°C for one hour and then treated with PBS or E. coli 25922 (MOI = 10) at 37°C for five hours. D2SC/1 dendritic cells first were treated with sialidase at 37°C for one hour and then were treated with PBS or E. coli 25922 (MOI = 10) at 37°C for one hour. (E) Cell surface levels of TLR4 were determined by flow cytometry. (F) Intracellular staining for TLR4. (G) Sialidase treatment reduced both α2-3– and α2-6–sialylation of D2SC/1 dendritic cells. Cells were stained with MAA or SNA under the same conditions. (H) TNF-α in the cell culture supernatants was analyzed with cytokine bead array. D2SC/1 cells were first treated with sialidase or PBS at 37°C for one hour and then treated with PBS or E. coli 25922 (MOI = 10) at 37°C for five hours. Representative FACS profiles were shown. The bar graphs under the FACS profiles present the average mean fluorescence intensity (MFI) value ± SEM from one representative experiment (n=3, cells from three different mice in A, B, C and three independent samples in E, F, G), the color on individual bar in the bar graph corresponds to the color of the line in FACS profiles. Experiments depicted in this figure have been reproduced three times.

