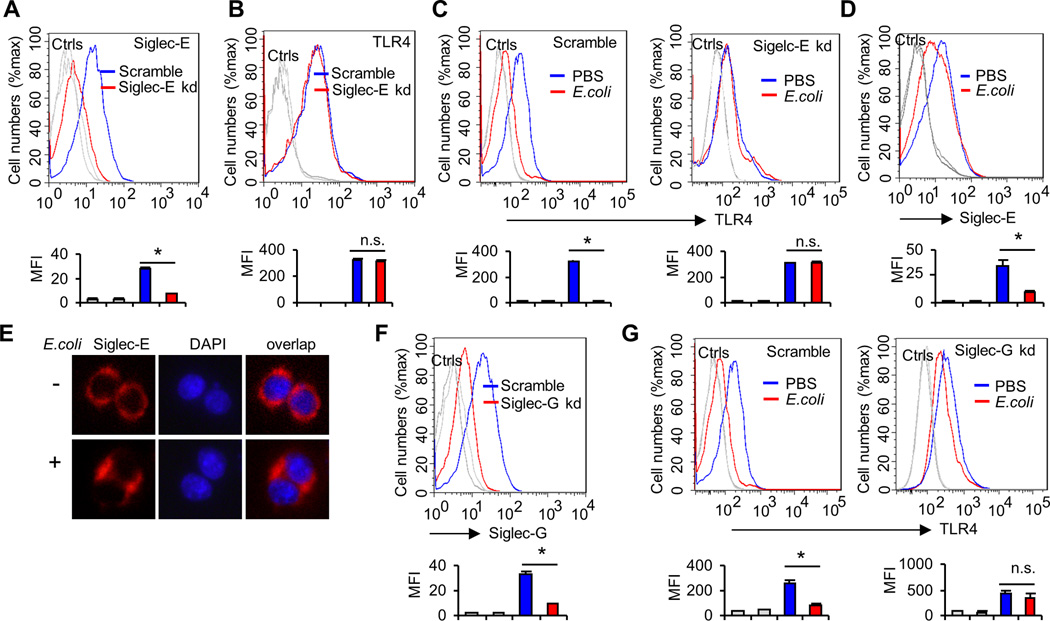
FIGURE 3. Effects of Siglec-E knockdown on E. coli-induced TLR4 endocytosis.
(A) ShRNA silencing of Siglec-E affects cell surface Siglec-E levels. D2SC/1 dentritic cells were transduced with a lentiviral vector carrying scrambled shRNA or Siglec-E shRNA. After transduction and selection with puromycin, stable clones expressing the shRNA were isolated and expanded under the selection of 2 µg/ml puromycin. Data shown are histogram of flow cytometry results depicting cell surface expression of Sigelc-E in D2SC/1 clones. (B) Silencing Siglec-E by lentivirus shRNA does not affect the cell surface expression of TLR4. Data shown are histograms of flow cytometry depicting cell surface expression of TLR4 in D2SC/1 clones. (C) Silencing Siglec-E by lentivirus shRNA reduces the E. coli-induced TLR4 endocytosis. D2SC/1 dendritic cells were treated with PBS or E. coli 25922(MOI = 10) at 37°C for one hour. Flow cytometry was then used to examine TLR4 endocytosis by determining the surface levels of TLR4 using anti-TLR4 antibody. (D) Expression of Siglec-E on D2SC/1 cell surfaces was determined by flow cytometry. Cells were treated as in c. (E) Translocation of Siglec-E in D2SC/1 cells. Cells were plated on chamber slides, treated with PBS or E. coli 25922(MOI = 10) at 37°C for one hour and then stained with anti-Siglec-E or DAPI. (F and G), Siglec-G is not required for E. coli-induced TLR4 endocytosis. (F) ShRNA silencing of Siglec-G affects cell surface Siglec-G levels. D2SC/1 dendritic cells were transduced with lentiviral vector carrying scrambled shRNA or Siglec-G shRNA. After transduction and selection with puromycin, stable clones expressing the shRNA were isolated and expanded under the selection of 2 µg/ml puromycin. Data shown are histograms of flow cytometry results depicting cell surface expression of Sigelc-G in D2SC/1 clones. (G) Silencing Siglec-G by lentivirus shRNA does not affect E. coli-induced TLR4 endocytosis. D2SC/1 dendritic cells were treated with PBS or E. coli 25922(MOI = 10) at 37°C for one hour. Flow cytometry was then used to examine TLR4 endocytosis by determining the cell surface levels of TLR4. Representative FACS profiles were shown. The bar graphs under the representative FACS profiles present the average MFI value ± SEM from one representative experiment with three independent samples, the color on individual bar in the bar graph corresponds to the color of the line in FACS profiles. Experiments depicted in this figure have been reproduced 2–3 times.

