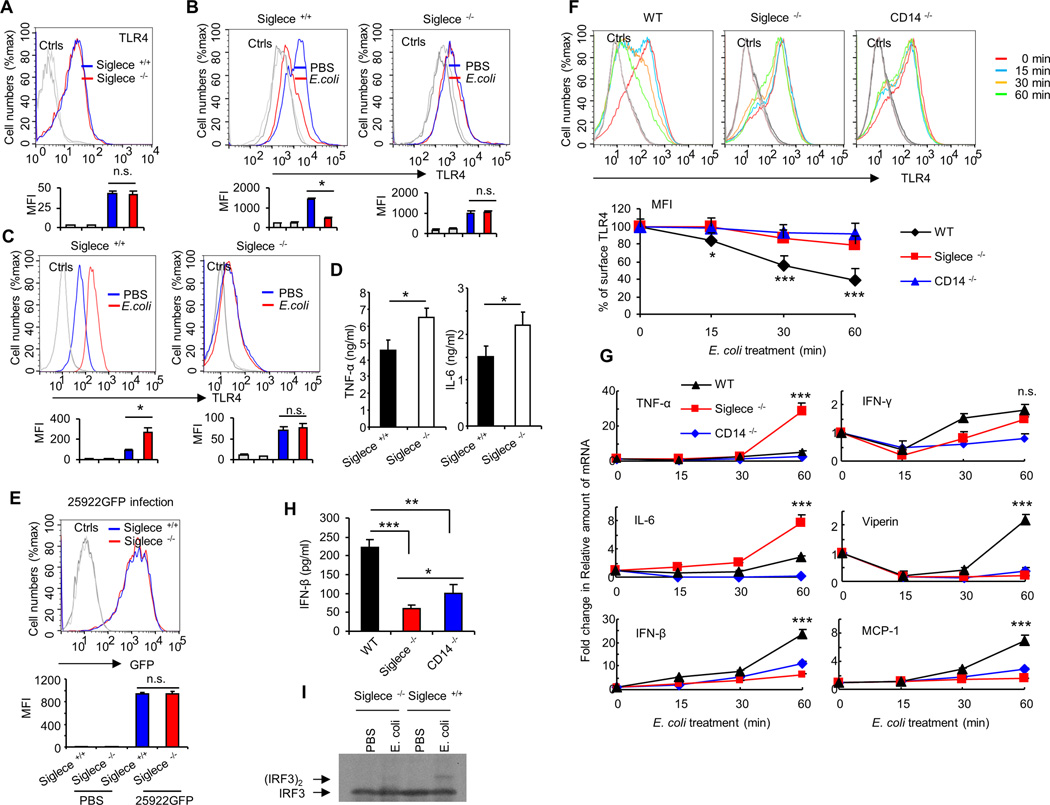
FIGURE 4. Siglec-E is required for E. coli-induced TLR4 endocytosis in vitro.
(A) Expression of TLR4 on bone marrow derived-dendritic cell surfaces was determined by flow cytometry. Dendritic cells cultured from WT or Siglece −/− bone marrow. (B) Bone marrow derived-dendritic cells treated with PBS or E. coli 25922 (MOI = 10) at 37°C for one hour. Flow cytometry was then used to examine TLR4 endocytosis by determining the cell surface levels of TLR4. (C) Intracellular TLR4 under the same conditions. (D) Cytokines in the cell culture supernatants were analyzed with cytokine bead array. Bone marrow derived-dendritic cells were treated with PBS or E. coli 25922 (MOI = 10) at 37°C for five hours. (E) Bone marrow derived-dendritic cells treated with E. coli 25922GFP (MOI = 10) at 37°C for one hour. Flow cytometry was then used to examine GFP fluorescent intensity for detecting the bacterial load in cells. (F) WT or Siglec-E-deficient or CD14- deficient mice dendritic cells were untreated or treated with E. coli (MOI = 10) for the times indicated. Flow cytometry was then used to examine TLR4 endocytosis by determining the cell surface levels of TLR4. Upper panels show representative profiles, and lower panels show time course as a percentage of initial mean fluorescence intensity. (G) Evaluation of the expression of genes in WT or Siglec-E-deficient or CD14- deficient mice dendritic cells untreated or treated with E. coli (MOI = 10) for the times indicated by real-time PCR using specific primer sets. (H) IFN-β in the cell culture supernatants were analyzed by ELISA. Bone marrow derived-dendritic cells were treated with PBS or E. coli 25922 (MOI = 10) at 37°C for three hours. (I) Bone marrow derived-dendritic cells were treated with PBS or E. coli 25922 (MOI = 10) at 37°C for one hour and the presence of active (dimerized) IRF3 in the cell extracts was determine by native PAGE. Representative FACS profiles were shown. The bar graphs under the representative FACS profiles present the average MFI value ± SEM from one representative experiment (n = 3, cells from three different mice), the color on individual bar in the bar graph corresponds to the color of the line in FACS profiles. Experiments depicted in this figure have been reproduced 2 or 3 times.

