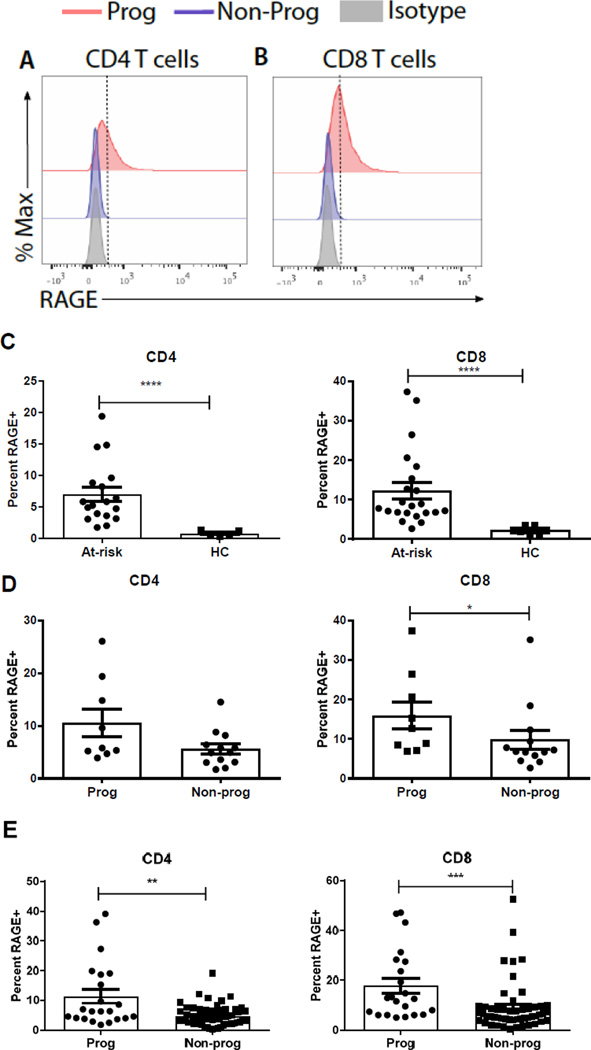
Fig. 1. At-risk individuals progressing to T1D express significantly higher levels of intracellular RAGE in T cell populations.
(A–B) Representative intracellular RAGE staining in CD4 (A) and CD8 (B) T cells from a single visit in progressors (red; Prog) or non-progressors (blue; NP). Isotype control staining is in grey. (C) The median percentage of RAGE+ CD4 (circles) and CD8 (triangles) T cells was determined for each at-risk subject and for healthy control subjects. There was an increase in the frequency of RAGE+ CD4+ and CD8+ T cells in the at-risk subjects compared to healthy controls (HC) (mean±SEM is shown, p<0.0001 for both, Mann-Whitney test)(D) The frequency of the median of RAGE+ T cells for each individual was compared in the at-risk progressors and non-progressors. There was a significantly greater frequency of RAGE+ CD8+ T cells in the at-risk progressors compared to those who did not develop T1D (p=0.036, mean±SEM, Mann-Whitney test) (E) The frequency of RAGE expression in CD4+ and CD8+ T cells at each study visit is shown. (**p=0.0037***p=0.0004, mean±SEM, Mann-Whitney test).

