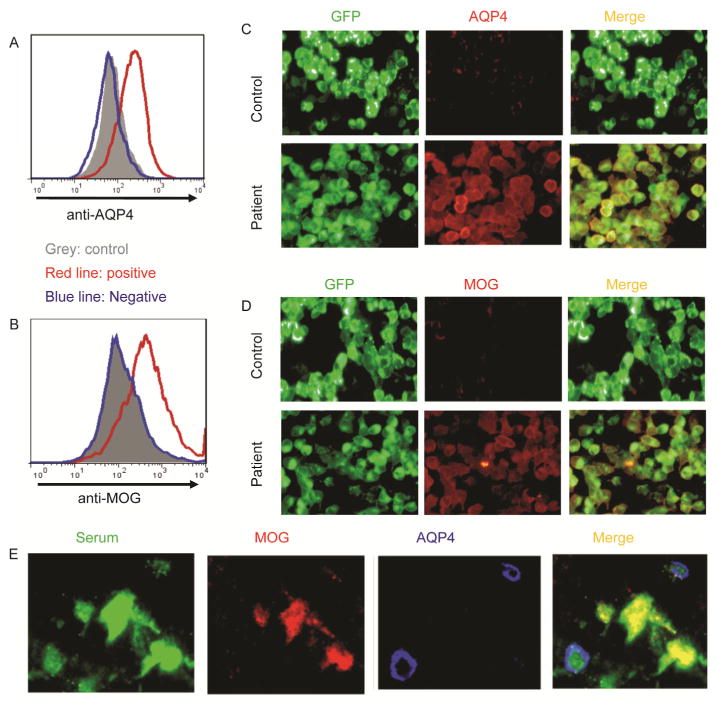
Figure 2.
Representative detection of AQP4-ab and MOG-ab in a patient with NMOSD. A, AQP4-ab detection by the Fluorescence-activated cell sorting (FACS) analysis. B, MOG-ab detection by the Fluorescence-activated cell sorting (FACS) analysis. C, AQP4-ab detection by the fluorescence microscope-based cell binding assay. D, MOG-ab detection by the fluorescence microscope-based cell binding assay. E, The fixed sections of rat brain or spinal cord were co-stained with diluted patient serum (green), rabbit anti-human AQP4 (red) and goat anti-human MOG polyclonal antibodies (blue). In sections from the AQP4-ab and MOG-ab double-positive patients, merged green-red and merged green-blue are visible.

