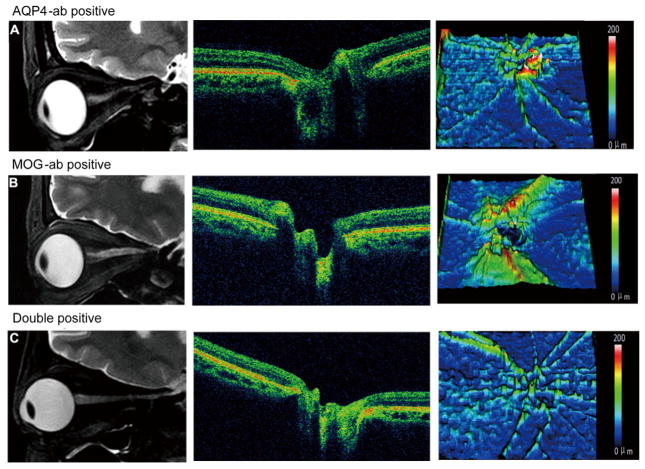
Figure 7.
Optica nerve and retinal nerve fiber layer thickness in NMOSD patients with different antibody profiles at the last follow-up. A, Images from a patient with AQP4-ab and a 5-year course of disease. B, Images from a patient with MOG-ab and a 5-year course of disease. C, Images from a patient with both AQP4-ab and MOG-ab and a 2-year course of disease. Left, optic nerve MRI. Middle, Optical coherence tomography images of the peri-papillary area of retinal nerve fiber layer. Right, Thickness maps of the retinal ganglion cell layer of retinal nerve fiber. Optica nerve demyelination is evident as atrophy on optic nerve MRI, and neuroaxonal retinal damage appears as thinning of peri-papillary tissue measured by OCT. This condition was more severe in eyes of patients with optic neuritis who had AQP4-ab and MOG-ab than in those with either AQP4-ab alone or MOG-ab alone.

