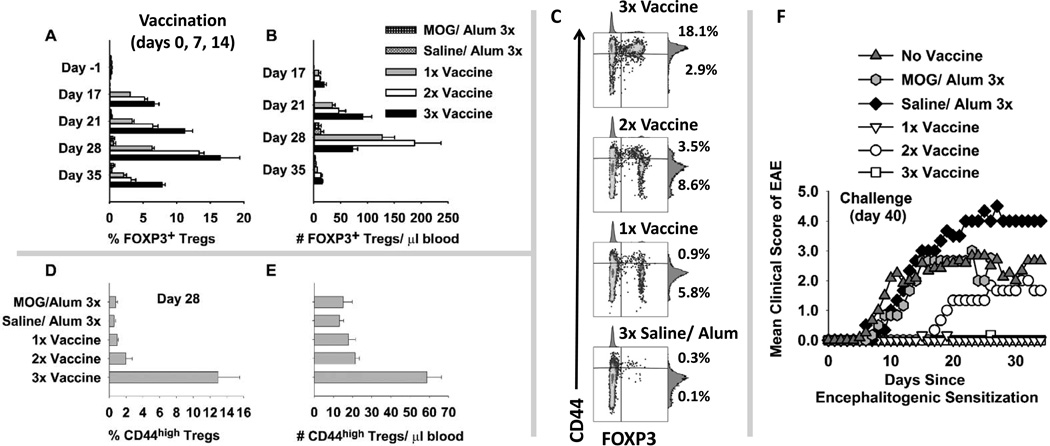
Figure 7. The “IFN-β + MOG in Alum” vaccine elicited FOXP3+ Tregs and tolerance in 2D2 TCR transgenic mice.
2D2-FIG mice were given three (3x) injections (days 0, 7, 14), two (2x) injections (days 7 and 14), or one (1x) injection (day 14) of 5 nmoles of the “IFN-β + MOG in Alum” vaccine (n = 3). When not receiving tolerogenic vaccination, mice received a control injection of Saline in Alum. Control mice were given three (3x) injections (days 0, 7, 14) of “Saline in Alum” or 5 nmoles of “MOG in Alum” (n = 3). Mice were assessed for percentages (A) (relative to 2D2 T cell population) and absolute numbers (B) (cells/ µl blood) of circulating FOXP3+ Tregs on days 17, 21, 28, and 35. (A) 3x or 2x versus MOG or Saline, p < 0.010 for days 17–35; 1x versus MOG or Saline, p < 0.05 for days 17–28. (B) 3x versus MOG or Saline, p < 0.006 for days 17–35; 2x versus MOG or Saline, p < 0.006 for days 17–28. (C) On day 28, CD3+ T cells were analyzed for expression of CD44 (y-axis) and FOXP3+ (x-axis). Percentages of CD44high Tregs and CD44low Tregs (upper and lower right quadrants) are given for each representative dotplot. Mean percentages (D) and numbers (E) of CD44high FOXP3+ Tregs are shown (3x versus the other 4 groups, p ≤ 0.001). (A-B, D-E) Shown are means and standard error of the mean. Analysis panels included CD25-BV421, TCR-Vα3.2-PE, CD3-PE.CF594, CD44-APC, and CD45-BV785. (F) Mice were challenged with 100 µg MOG35-55 in CFA on day 40, were given Pertussis toxin on days 40 and 42, and were weighed/ scored for EAE daily for the next 34 days. The compiled clinical data and statistical analysis of EAE are provided in Table 2.

