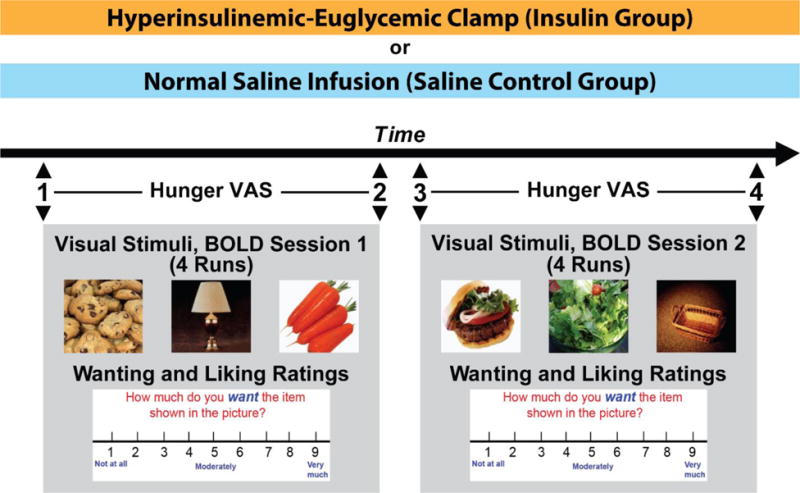
Figure 1. Study Procedure (Event-related fMRI design).

34 subjects underwent either a hyperinsulinemic-euglycemic clamp (n=18) or a normal saline infusion (n=16) while in an MRI scanner. The scan consisted of two sessions of functional MRI using blood oxidation level dependent (BOLD) signaling. During each session, 4 runs of 21 pictures (7 High Calorie Food (HC), 7 Low Calorie Food (LC), and 7 Non-Food (NF)) in random order were projected onto a screen in the scanner. Right after a picture presentation (6 seconds), subjects were shown a visual analog scale and given 3 seconds each to rate their wanting and liking for the item in the picture on a scale of 1 (“not at all”) to 9 (“very much”). Immediately prior to and immediately after each session (time points 1, 2, 3 and 4), the subjects were presented with a rating scale and asked to rate their hunger on a scale of 1 (“not at all hungry”) to 9 (“extremely hungry”).
