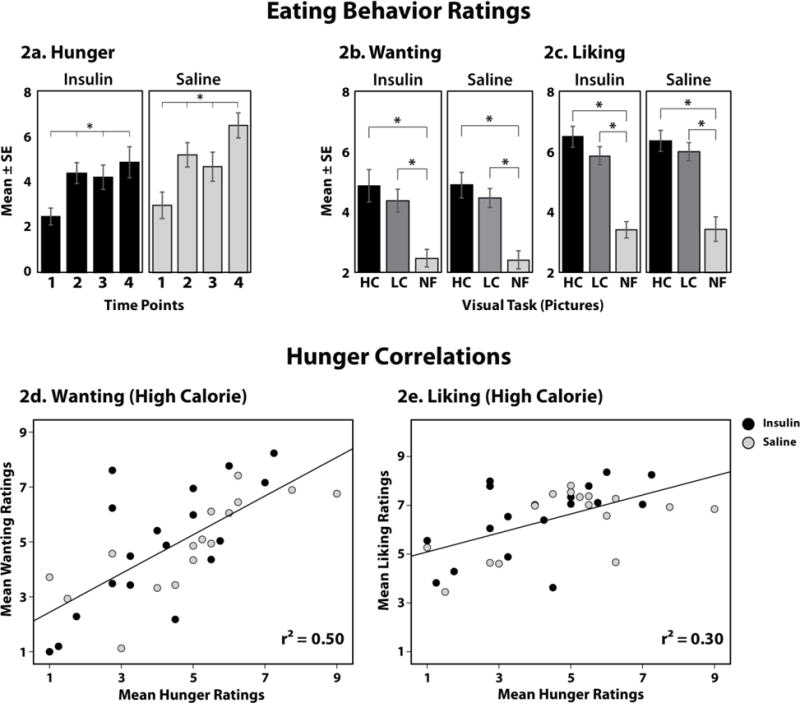
Figure 2. Eating Behavior Ratings and Hunger Correlations.

(2a.) Mean hunger ratings for each group at each of the 4 time points during the study. (2b.) Mean wanting and liking ratings for High Calorie (HC), Low Calorie (LC), and Non-Food (NF) images in both groups. (2d–e.) Correlation graphs for Mean Hunger ratings with Mean Wanting (2d) and Mean Liking ratings (2e) during high calorie foods by group. There were no significant group differences by mixed repeated-measures ANOVA. P<0.05.
