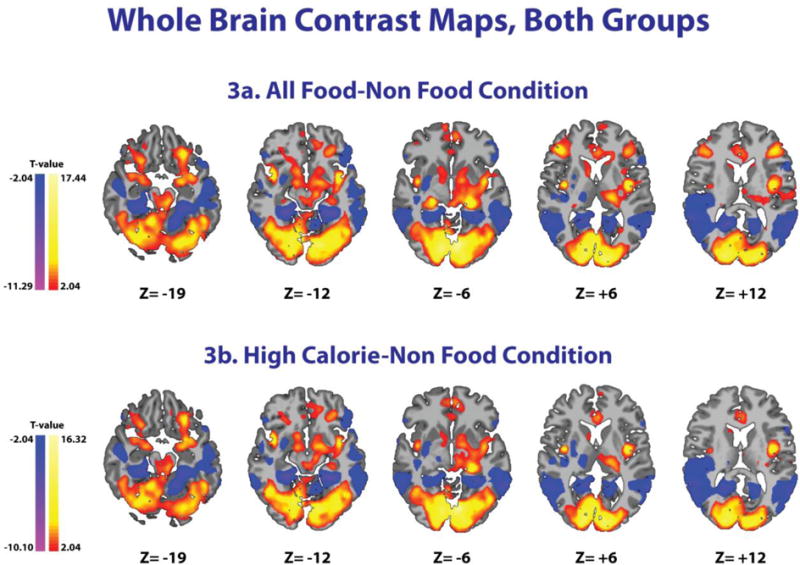
Figure 3. Differences between Food and Non-Food Conditions.

Whole brain contrast maps for all 34 subjects (Insulin and Saline groups) showing increased activity in red/yellow and decreased activity in blue/purple. Increased activity can be seen in the striatum (dorsal, ventral), ventromedial prefrontal cortex, dorsolateral prefrontal cortex, insula, amygdala, hypothalamus, and occipital lobe for both All Food and High Calorie conditions relative to the Non-Food condition. MNI coordinates were used. T-test, FWE correction at P<0.05.
