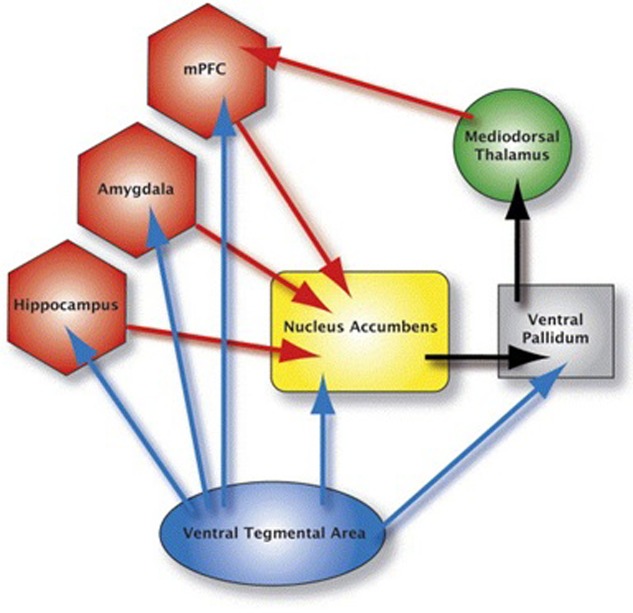
FIGURE 1.
This figure depicts the mesocorticolimbic system. The blue arrows represent dopaminergic pathways: the red arrows represent glutamatergic pathways; black arrows represent GABAergic pathways. Brain areas anterior cingulate, insula, orbital frontal cortex and dorsolateral prefrontal cortex are not shown in the figure.

