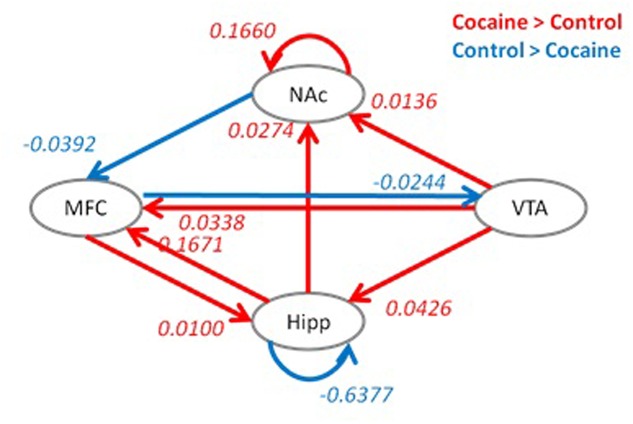
FIGURE 4.
Group differences in effective connectivity parameters between the cocaine and control groups. Red indicates a greater effective connectivity in the cocaine group compared to the control group, and blue indicates a reduced effective connectivity in the cocaine group compared to the control group. Significant group differences were identified after false discovery rate (FDR) correction at p < 0.05. Hipp, hippocampus; MFC, medial frontal cortex; VTA, ventral tegmental area; NAc, nucleus accumbens.

