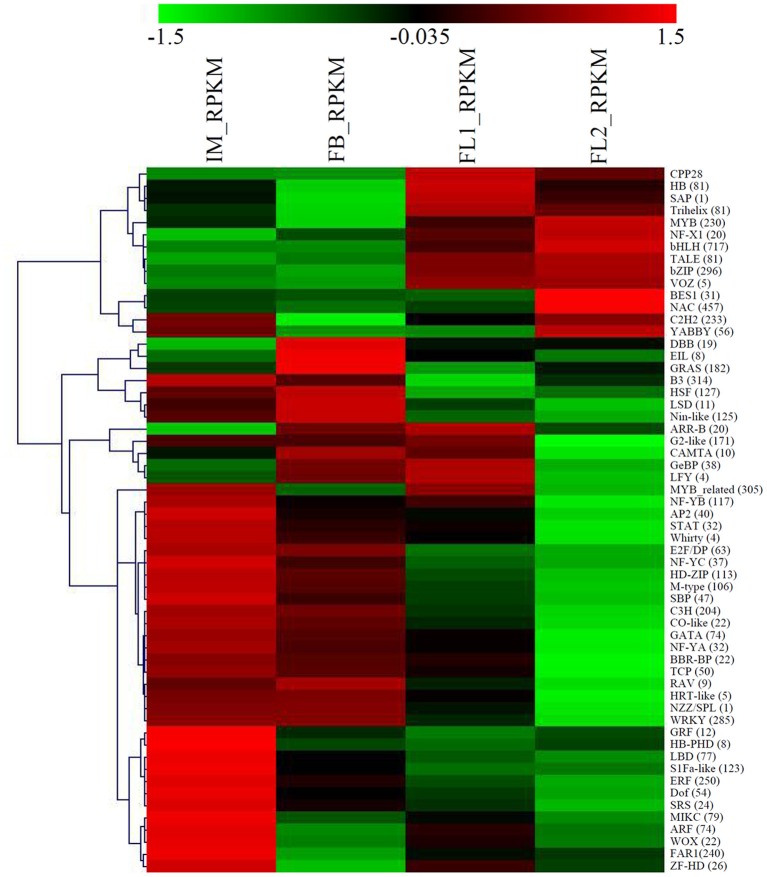
Figure 4.
Identification and analysis of floral transition and flower development-associated transcription factor genes. A heat map depicting the overall trend of the differential expression profiles of the transcription factor genes during flower development was constructed using MeV. The number of each transcription factor was showed in parentheses.

