
Figure 3.
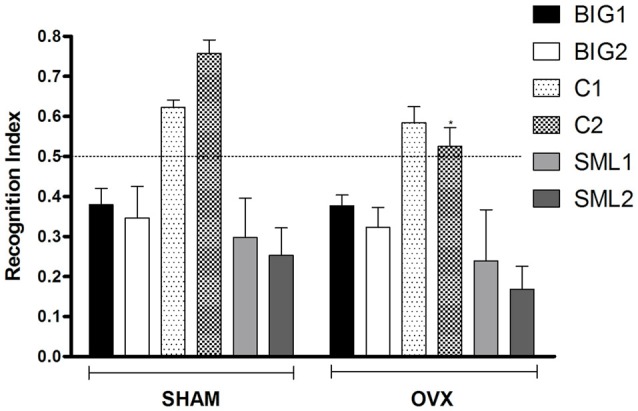
Novel object recognition in BIG, SMALL and Control strains. The data represent the mean (± SEM) for the recognition index (RI) in the novel object recognition test between sham and OVX groups of the two replicates of the BIG, SMALL and Control strains. *(p < 0.05) indicates significant differences between sham and OVX groups.