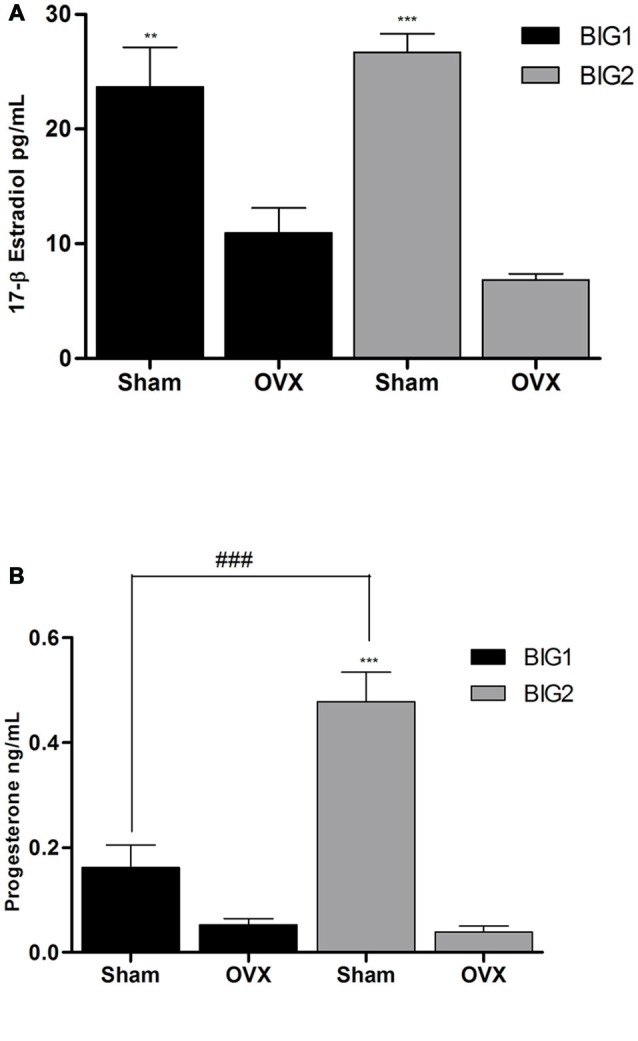
Figure 4.

Ovarian E2 and P4 plasma levels in BIG strains. The data represent the mean (± SEM) for plasma (A) 17β-estradiol (E2) levels and (B) progesterone (P4) levels of the BIG1 and BIG2 strains. **(p < 0.001) and ***(p < 0.0001) indicates significant differences between sham and OVX groups. ###(p < 0.0001) indicate significant differences between replicate strains.
