Figure 3.

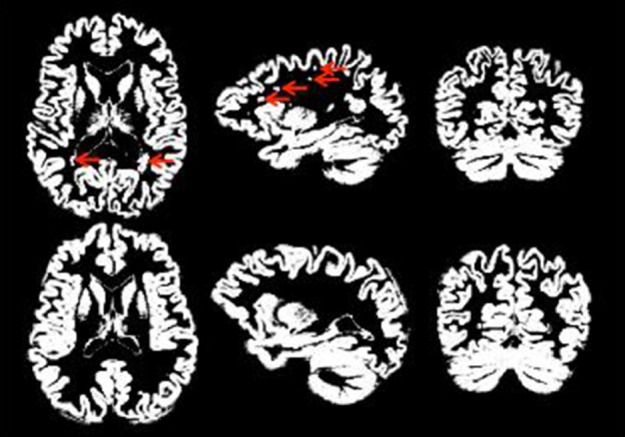
Good (bottom row) vs. poor (top row) GM segmentation. Red arrows indicate regions that are problematic/incorrectly classified as gray matter.

Good (bottom row) vs. poor (top row) GM segmentation. Red arrows indicate regions that are problematic/incorrectly classified as gray matter.