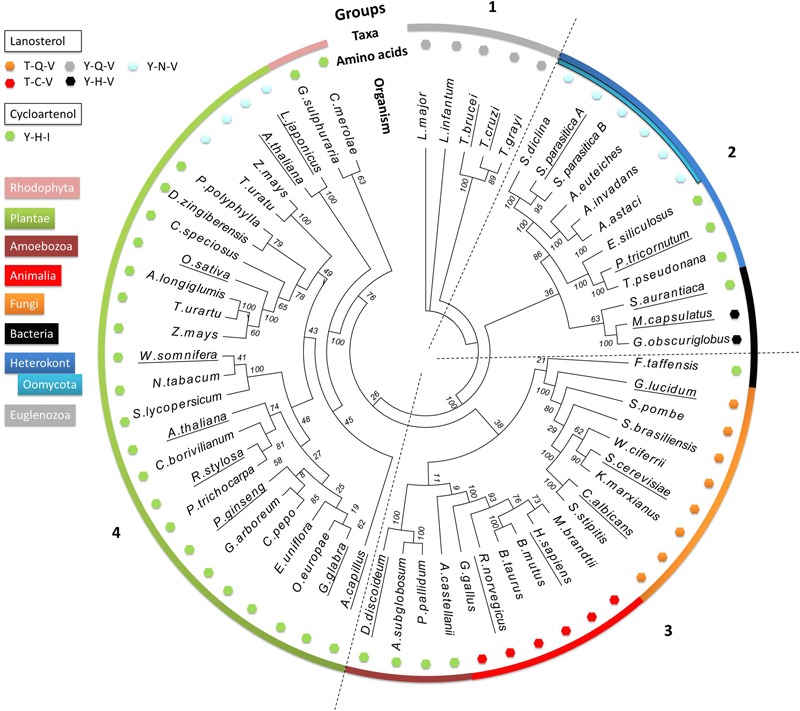
FIGURE 3.

Phylogenetic analysis of 63 characterized and predicted OSC sequences. Species group into four clades, numbered 1–4. The outer colored ring denotes the taxonomic groups of the species from which the sequences originate, as indicated by the color key. The small colored hexagons each correspond to a different triad amino acid pattern. The names of the species for which enzyme specificity has been biochemically demonstrated are underlined. Bootstrap values from 100 replicate analyses are shown at each root branch. Full organism names and sequence identification numbers are listed in Supplementary Table S1.
