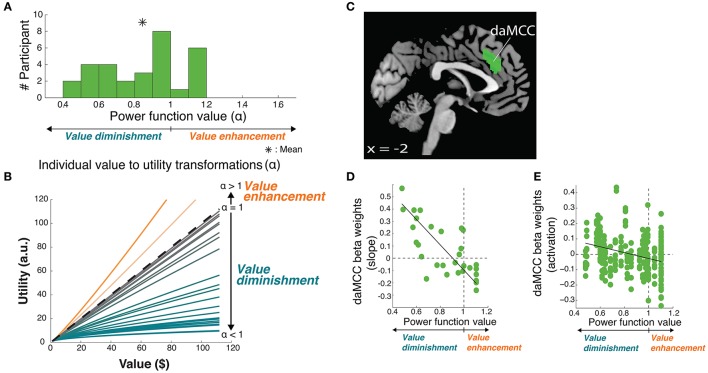
Figure 3.
Value-to-utility transformation for gains. (A) Distribution of risk preferences in the gains domain as measured by power function values (α). (B) Distribution of individual value-to-utility transformations revealed by individual preferences. (C) Neural regions encoding the value-to-utility transformation. (D) Relationship between individual preferences and extracted daMCC beta values (slopes) from the covariate analysis. Note that the points are extracted from a whole-brain identified ROI, and are meant to illustrate the already-identified relationship. (E) Relationship between individual preferences and extracted daMCC betas values (activation) from the categorical model.

