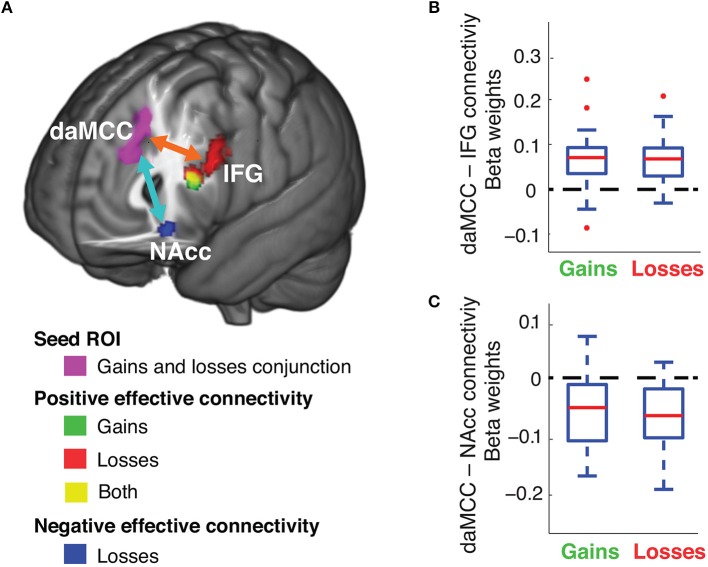
Figure 5.
Functional connectivity of the daMCC during decision making. (A) Brain areas with decision-related functional connectivity to the daMCC. (B) Connectivity between daMCC and IFG, extracted from the conjunction of the significant voxels in the IFG for both gains and losses. (C) Connectivity between daMCC and NAcc, extracted from the losses NAcc region (for boxplot: red line is median, blue solid box indicates the 25–75 percentile, error bar indicates the range of non-outlier extreme values, “+” indicates outliers).

