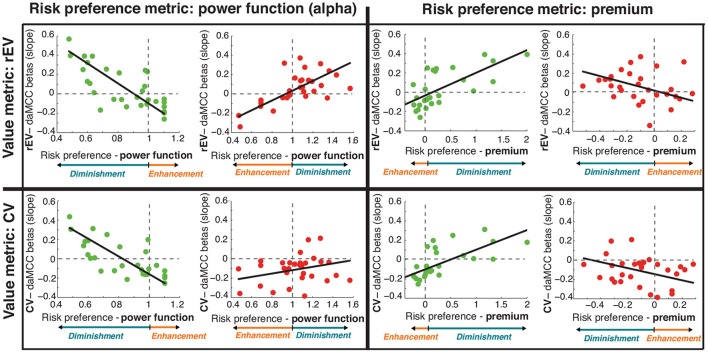
Figure 6.
Relationship between individual preferences and daMCC betas (slopes) across alternative formulations of value and risk preference. Results from Figures 3C, 4C (in top left cell; gains in green and losses in red) were tested for robustness across a 2 × 2 space. Note that the relationship between risk preference and value subjectification is inverted across gains and losses, and also across the two risk preference measures. For each graph, the relation of the preference metric and value subjectification is shown in color at the bottom. Of note, all eight subplots show the same relationship between daMCC betas and value subjectification—increasing for value diminishment and decreasing for value enhancement.

