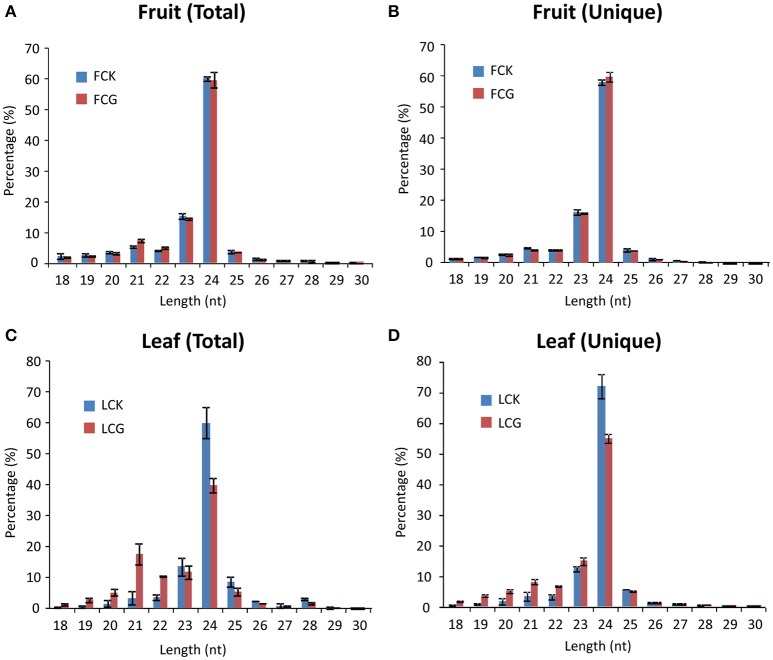
Figure 2.
Size distribution of sRNAs from healthy and CGMMV-infected L. siceraria. (A) Total sRNAs from fruit. (B) Unique sRNAs from fruit. (C) Total sRNAs from leaves. (D) Unique sRNAs from leaves. FCK, Healthy fruit; FCG, CGMMV Infected fruit; LCK, Healthy leaf; LCG, CGMMV Infected leaf. Error bars indicate ± SD calculated from three biological replicates. The numbers in the horizontal axis indicate length of vsiRNAs, and numbers in the vertical axis indicate percentage of vsiRNAs in healthy or CGMMV-infected samples.

