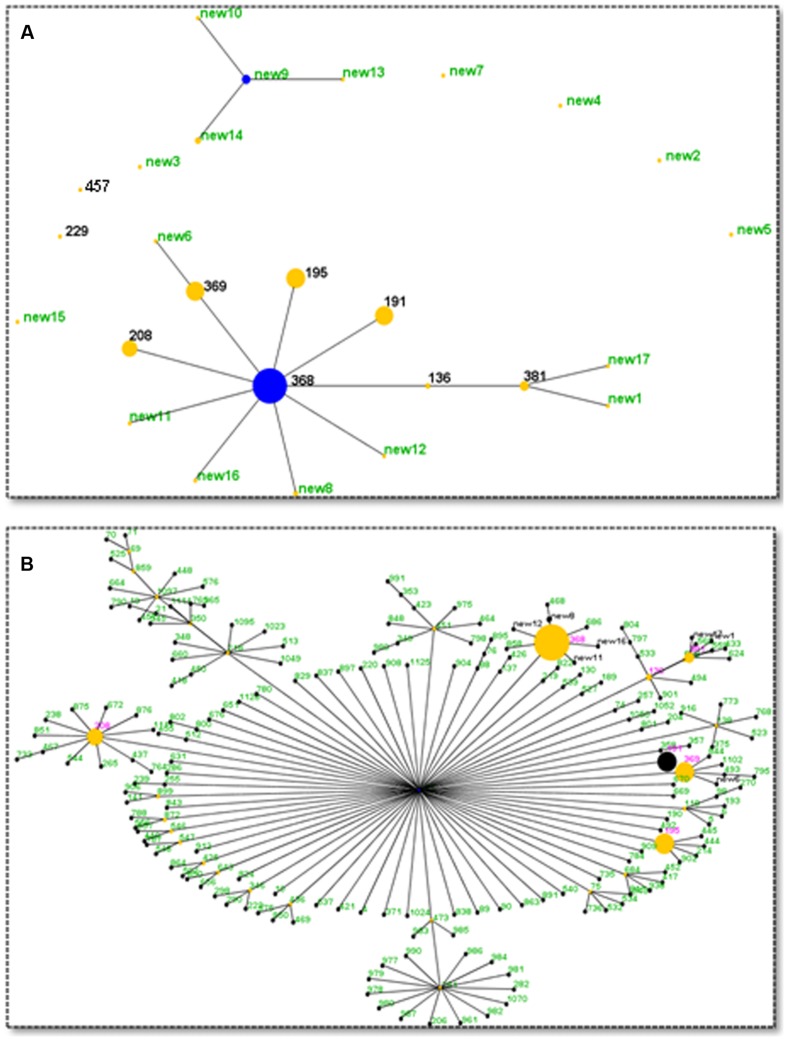
FIGURE 3.
eBURST analysis results. (A) Relationships among the STs found in this study. Two clonal complexes were identified. Blue dot denotes the founder and yellow dots denote the sub-founder. The size of the dot indicates the number of isolates. (B) Current members (STs) of CC92. Seven CC92 STs identified in this study are shown in red, and seven new CC92 STs are shown in black. Other previously reported CC92 STs are shown in green.

