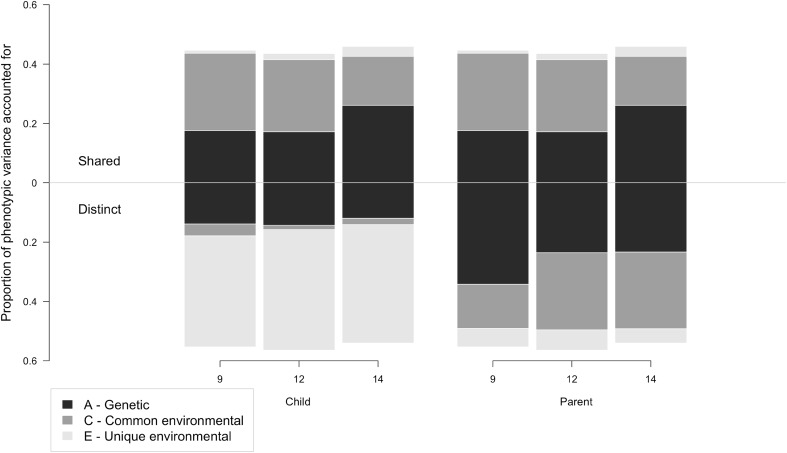
Fig. 3.
Proportion of variance in child- and parent-reported parenting explained by genetic, common environmental and unique environmental components of shared and distinct perceptions. Note: Proportion of shared variance plotted above horizontal centre line, variance distinct to each reporter (ordered child/parent) plotted below; bars divided based on the proportionate influence of genetic (A), common environmental (C) and unique environmental (E) factors; values from full psychometric model with scalar

