
Fig. 3.
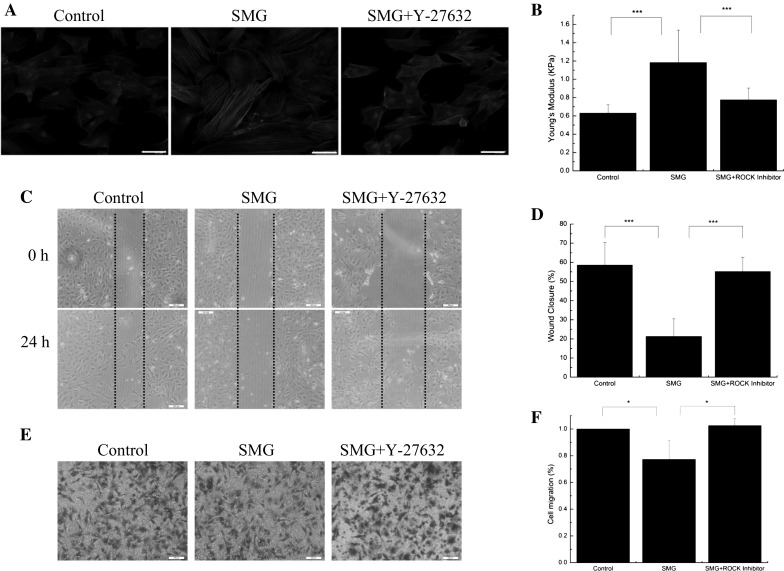
SMG inhibits the migration potentials of BMSCs via Rock-F-actin pathway. a Fluorescence images of the F-actin cytoskeleton (red) and nucleus (blue) of BMSCs, cultured for 24 h under SMG, with or without Y-27632 (5 μM). b Young’s modulus of BMSCs with or without SMG exposure for 24 h, n = 20 in each group. c Wound healing experiments for the migration potentials of BMSCs after exposure to SMG for 24 h. d The results of statistical analysis. e Transwell experiments for the migration potentials of BMSCs after exposure to SMG for 24 h. f The results of statistical analysis. Bars in graph a, b and c are 50, 200 and 200 μm, respectively. The results are shown as the mean ± SD from three representative independent experiments. *p < 0.05, **p < 0.01 and ***p < 0.001. (Color figure online)