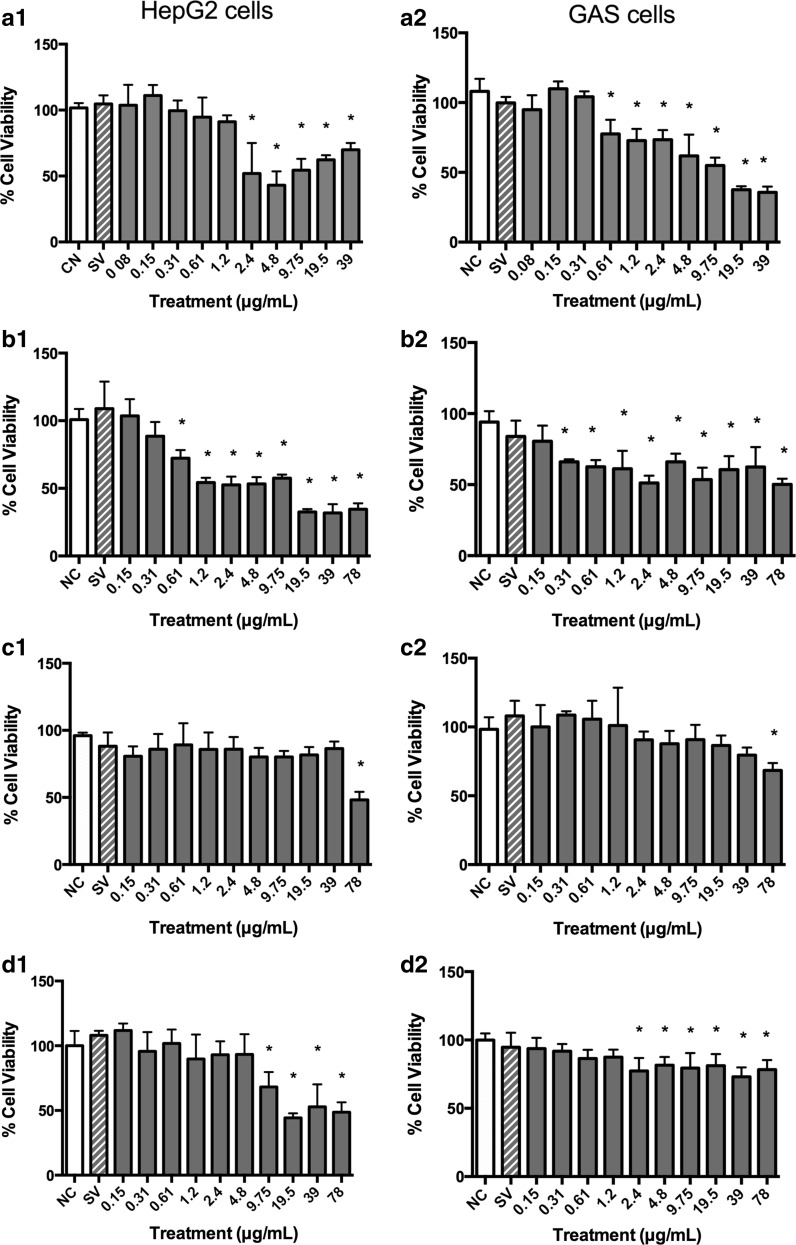
Fig. 3.
Cell viability of HepG2 (1) and GAS (2) cells 24 h after treatment with different extracts concentrations (Neutral Red assay): a B. correifolia; b B. verbascifolia; c B. fagifolia; and d B. intermedia; negative control—NC (PBS) and solvent (SV). The results represent mean ± SD of independent cultures in triplicate. NC represents 100 % viability. Asterisk values differ significantly from the negative control group by the ANOVA and Tukey test (p ≤ 0.05)

