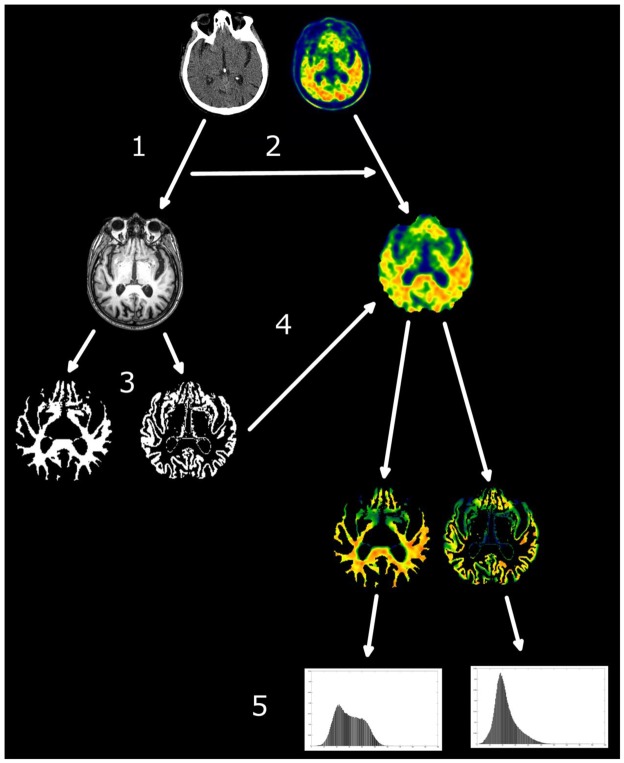
Figure 1.
Pipeline for histogram creation. CT scan was registered on the T1 scan (1) and the transformation matrix applied to the PET AV-45 scan (2). T1 was segmented in grey and white matter (3) and the binary masks of the tissues were applied to the PET AV-45 scan in T1 space (4). Intensity histograms were extracted from the tissues (5).

