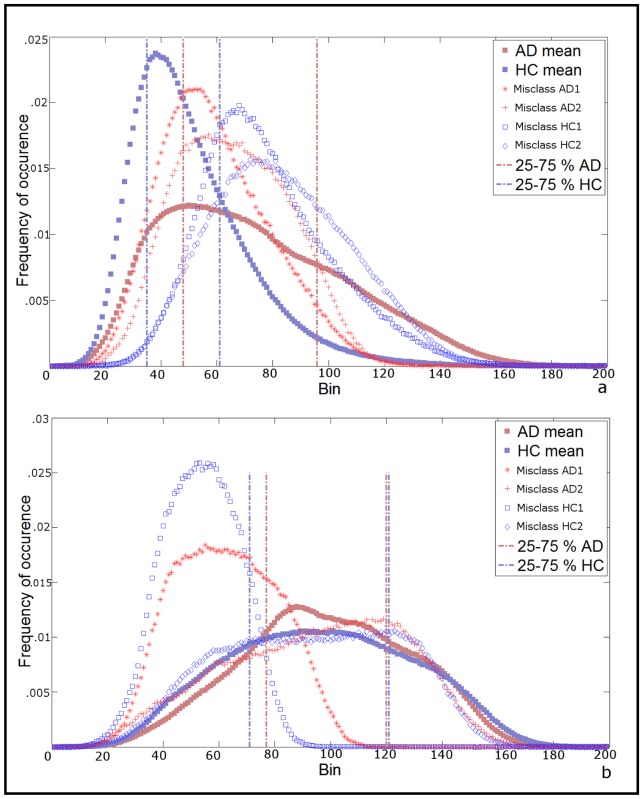
Figure 4.
Histogram shape of misclassified subjects. a) Grey matter mean histograms of the 2 AD patients classified as HC (red stars and red crosses) and the 2 HC classified as AD (empty blue squares and diamonds) in the discriminant analysis performed on grey matter histogram parameters plotted against the mean grey matter histogram of the correctly classified AD (filled red square) and HC (blue filled square). b) White matter mean histograms of 2 (out of 3) AD patients classified as HC (red stars and red crosses) and the 2 (out of 7) HC classified as AD (empty blue squares and diamonds) in the discriminant analysis performed on white matter histogram parameters, plotted against the mean white matter histogram of the correctly classified AD (filled red square) and HC (blue filled square). 1 out of 3 misclassified AD and 5 out of 7 misclassified HC are not shown for easiness of presentation, see supplementary Figure 2. Vertical pointed-dashed lines in both a and b panels mark 25th and 75th percentiles of histograms.

