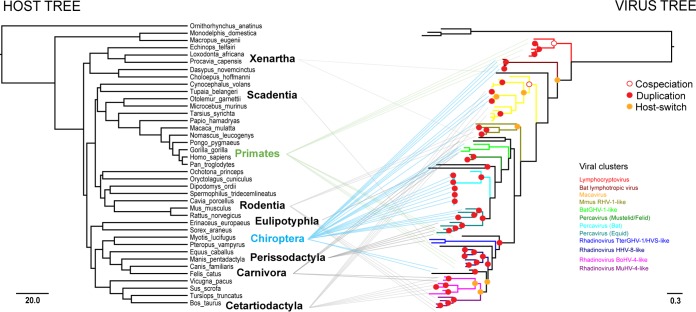
FIG 2 .
Tanglegram of the host-virus coevolution within the Gammaherpesvirinae subfamily. Higher host taxonomic levels are denoted in bold font. The virus phylogeny is represented by the gB tree. The gray lines indicate the connections between particular mammalian orders and viral lineages. The names and connecting lines of the two main groups where the most host-switching events were detected are shown in blue (bats) and green (primates). The estimated cospeciation (open circles), duplication (red circles), and host-switching events (yellow circles) obtained by cophylogeny analysis are shown on the virus tree. The scale bars indicate millions of years before present for the host tree (left) and amino acid substitutions per site for the virus tree (right).

