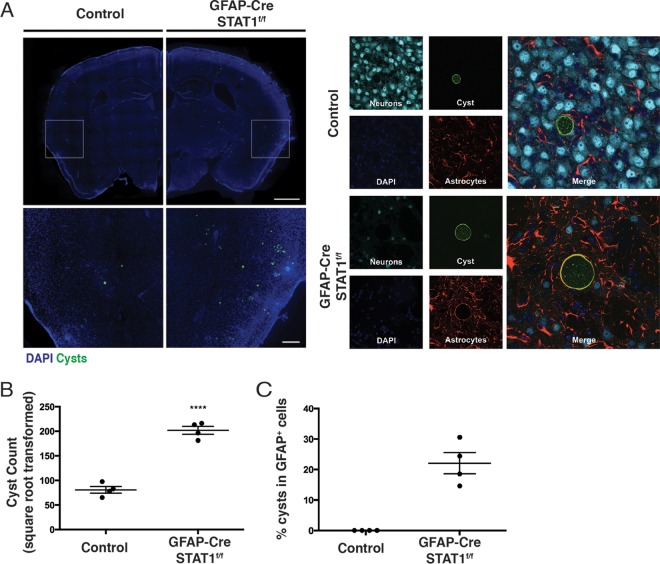
FIG 4 .
Altered distribution of cysts in GFAP-Cre STAT1f/f mice. (A) (Left) Control and GFAP-Cre STAT1f/f (n = 4) mice were infected i.p. with 20 cysts of the ME49 strain, mice were sacrificed at 25 dpi, and brain sections were stained to identify Toxoplasma cysts, neurons, and astrocytes, with DAPI being used to visualize host cell nuclei. Forty-micrometer-thick brain sections from 25-dpi control or GFAP-Cre STAT1f/f mice were stained with DAPI (blue) and bradyzoite-specific antigen SAG2X/Y (green). Sections were then examined by fluorescence microscopy. Representative image of whole-brain slices that were reconstructed using a stitched grid of maximum-projection images taken at ×10 magnification. Bar, 1 mm. Enlarged views of boxed regions are shown below. Bar, 200 µm. n = 4 mice per genotype, 7 sections per mouse. (Right) Representative images showing a cyst within a neuron in a control brain section (bar, 10 µm) or within a GFAP+ astrocyte in GFAP-Cre STAT1f/f mice. (B) The absolute numbers of cyst counts were square root transformed to account for variance between sections and mice (mean ± standard error of the mean; ****, P < 0.0001). (C) Percentage (mean ± standard error of the mean) of cysts present in GFAP+ host cells in these mice.

