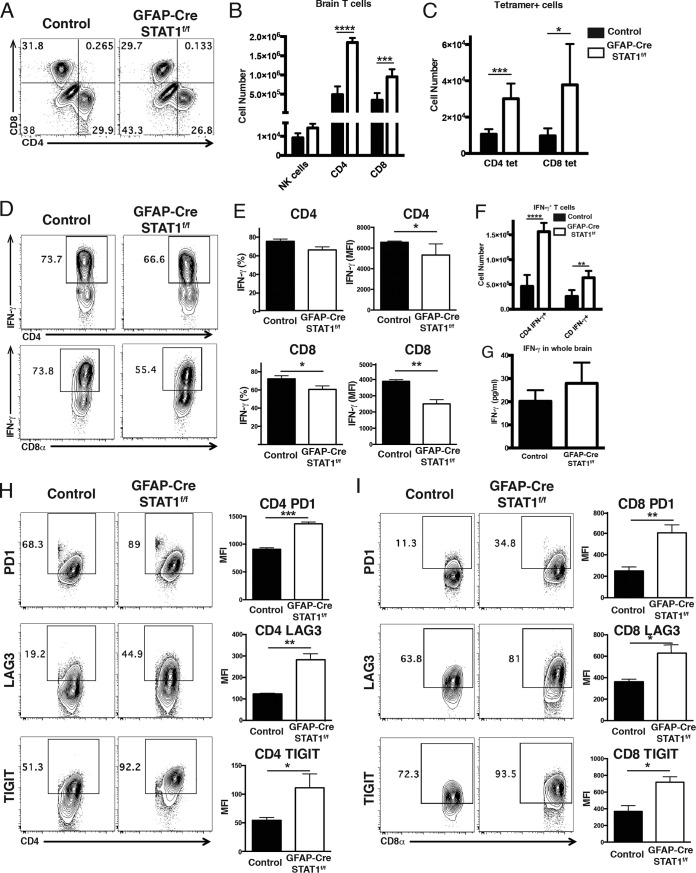
FIG 6 .
Analysis of production of IFN-γ and expression of inhibitory receptors in T cells during toxoplasmic encephalitis. Control and GFAP-Cre STAT1f/f mice were infected with T. gondii and analyzed at 25 dpi. (A and B) Mononuclear cell preparations from control and GFAP-Cre STAT1f/f mice were made, and FACS was used to quantify the numbers of NK cells and CD4+ and CD8+ T cells. (C) The BMNCs were stained for T. gondii-specific T cells using MHC class I tetramer for CD8+ T cells and MHC class II tetramer for CD4+ T cells, and the absolute number of tetramer+ T cells was calculated. (D) The BMNCs were analyzed for the production of IFN-γ+ by CD4+ and CD8+ T cells. (E) Frequency and mean fluorescence intensity (MFI) of IFN-γ production by CD4+ and CD8+ T cells. (F) Absolute number of IFN-γ+ CD4+ and CD8+ T cells. (G) Whole brain was homogenized in PBS, and supernatant was removed for IFN-γ enzyme-linked immunosorbent assay. (H and I) Comparison of expression levels of PD-1, LAG3, and TIGIT by CD4+ (H) and CD8+ (I) T cells in the BMNCs. The graphs show means ± standard errors of the means and averages from three to four mice per group, with similar results seen in a repeat experiment. *, P < 0.05; **, P < 0.01; ***, P < 0.005; ****, P < 0.001.

