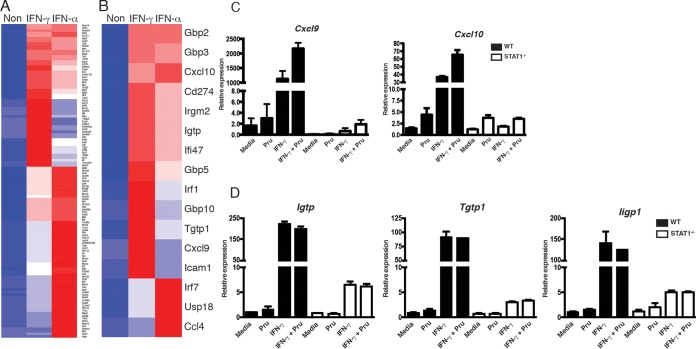
FIG 7 .
Identification of IFN-γ- and/or IFN-α-inducible genes in primary astrocytes and brain of T. gondii-infected GFAP-Cre STAT1f/f mice. Identification of genes that were differentially regulated 2-fold or more compared to unstimulated astrocytes by IFN-γ and IFN-α after 12 h of culture. (A and B) The cluster of genes is shown as a heat map. The heat map color indicates log2 expression value. This graph represents average gene expression for replicate arrays. (C and D) Astrocytes were preincubated with IFN-γ for 24 h prior to infection with Pru, and levels of Cxcl9 and Cxcl10 (C) and Igtp, Tgtp1, and Iigp1 (D) transcripts were normalized to expression of β-actin. The data presented are the mean ± standard error of the mean from three independent experiments.

