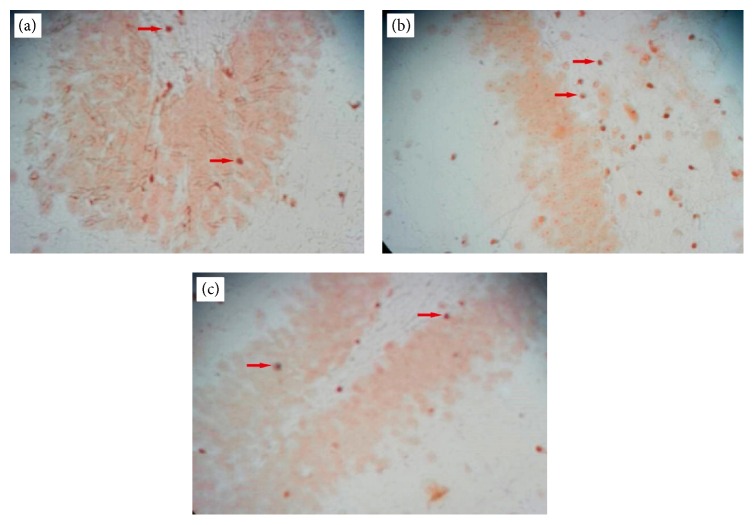
Figure 3.
TUNEL reaction. (a) Control group with the lowest number of TUNEL positive (apoptotic) cells. (b) Ischemia group with the highest number of TUNEL positive (apoptotic) cells. (c) Treatment group with fewer TUNEL positive (apoptotic) cells compared to the ischemia group. The arrows show TUNEL positive cells (brown).

