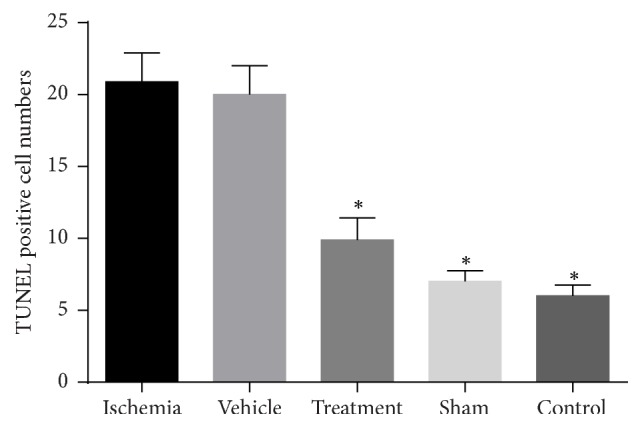
Figure 4.

The mean number of TUNEL positive cells in the study groups. The ischemia group had the greatest number of TUNEL positive cells. There was a significant difference (shown with ∗) in the numbers of apoptotic cells between the ischemia and control groups (P = 0.000).
