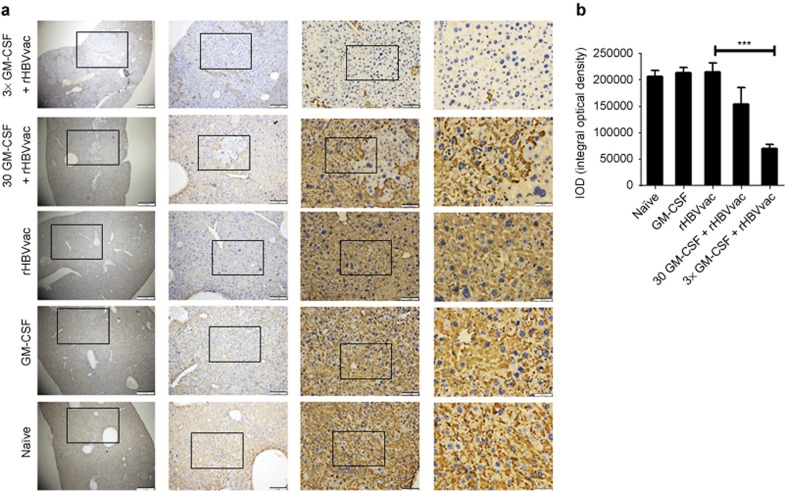
Figure 5.
Specific immunostaining of HBsAg in HBV transgenic mice on the 14th day after the third immunization. (a) Microscopic examination of liver sections with specific immunostaining of HBsAg; objective amplification from left to right is 40×, 100×, 200×, and 400×. (b) The integral optical density for HBsAg staining in each group. Data are expressed as mean ± SEM (n = 5) and represent one of the three independent experiments (***p < 0.001).

