Figure 8.

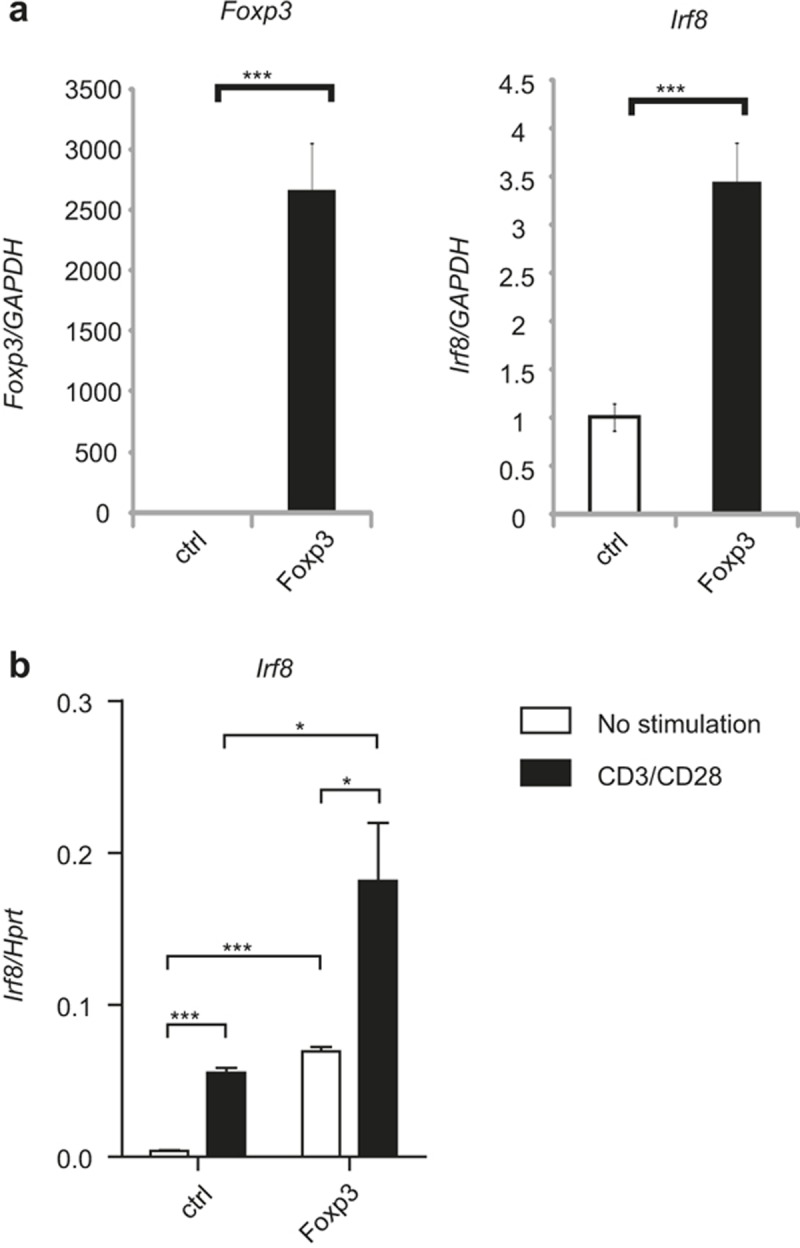
Foxp3 controls IRF8 expression. (a) Naïve CD4 T cells isolated from C57BL/6 mice were transduced with either control (MIEG)- or Foxp3-retroviral vector and stimulated under Th0 conditions. Transduced cells were sorted based on GFP expression, and RNA was isolated from the cells. Expression of Foxp3 and Irf8 was measured by quantitative RT-PCR. The error bar shows standard deviation (n = 3). Statistical difference was analyzed by Student's t-test. ***p < 0.001. (b) EL4 cells were transfected with control (CMV) or Foxp3-expression vector and stimulated with anti-CD3 and anti-CD28. RNA was isolated from the cells and the expression of Irf8 was analyzed by quantitative RT-PCR. The error bar shows standard deviation (n = 3). Statistical difference was analyzed by Student's t-test. *p < 0.05, **p < 0.01. Data are representative of four independent experiments with similar results.
