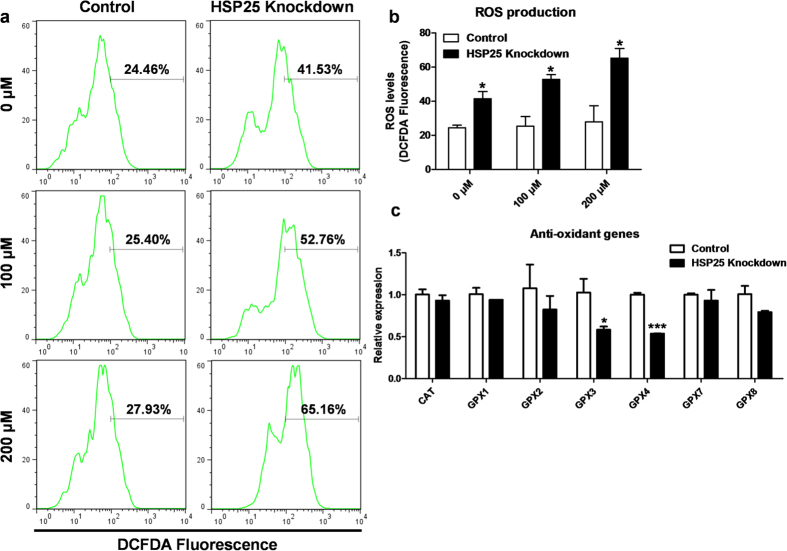
Figure 6. Anti-oxidant effect of HSP25 in H2O2-treated chicken blastoderm cells.
(a) DCFDA analysis by flow cytometry after HSP25 knockdown followed by H2O2 treatment (0, 100, or 200 μM). (b) Quantitative analysis of DCFDA-positive cells. (c) Relative expression analysis of anti-oxidant genes after HSP25 knockdown followed by 200 μM H2O2 treatment. Non-complementary sequences in the chicken genome were used as a control. Real-time PCR was conducted in triplicate and normalised to expression of GAPDH. Significant differences between control and HSP25 knockdown are indicated as ***P < 0.001 and *P < 0.05. Error bars indicate the SE of triplicate analyses.

