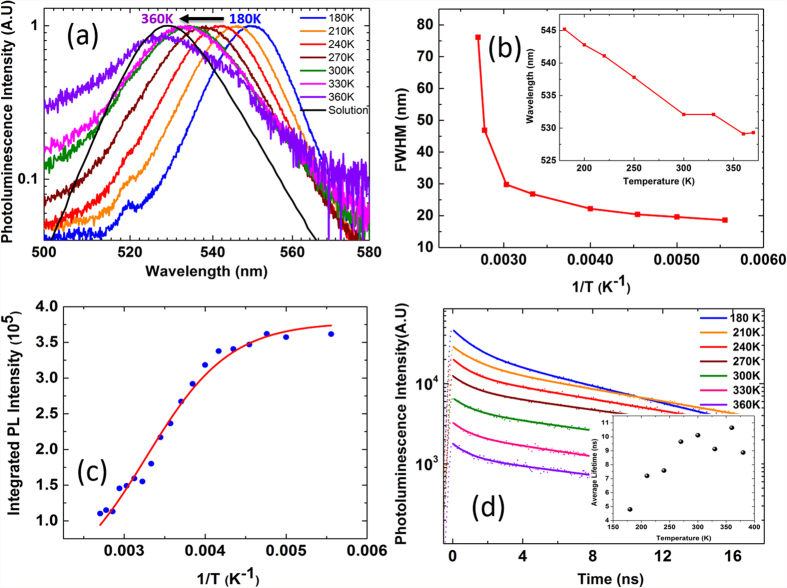
Figure 3.
(a) The normalized PL emission spectra under a pump fluence of 1.2 μJ cm−2 at temperatures ranging from 180–360 K. The PL spectra are normalized at their maximum intensity. (b) The change in FWHM is shown as a function of inverse temperature and in the inset the shift in the PL emission peak is shown as a function of temperature. (c) The integrated PL intensity as a function of inverse temperature and the Arrhenius fit (solid line) for temperature range 180–360 K (d) The TRPL intensity and the fit along with the average lifetime (inset) is shown for temperature range of 180–360 K.

