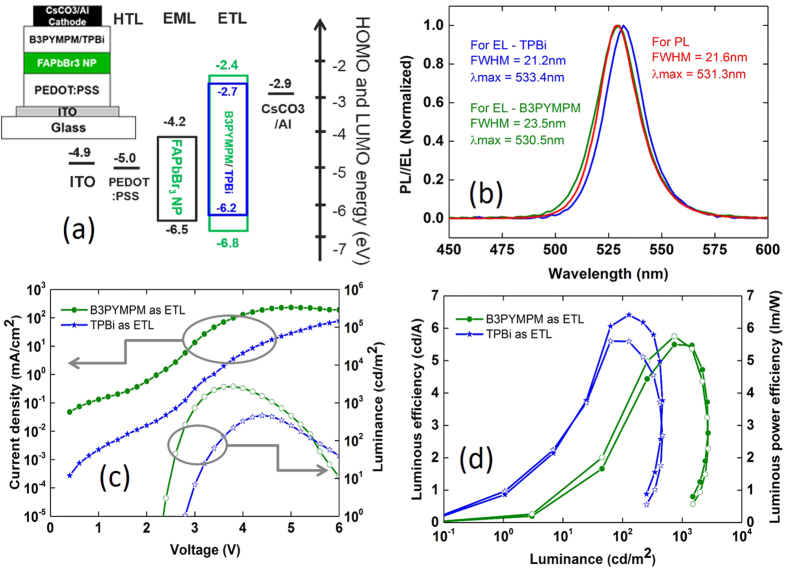
Figure 4.
(a) The device structure for the Pe-LED device and the corresponding schematic energy level diagram for the materials. (b) EL spectra for Pe-LED device with B3PYMPM (green line) and TPBi (blue line) as ETL are shown in Fig. 4 recorded at 0.5 mA/cm2. The PL spectrum of FAPbBr3 (red line is also shown for reference). (c) Current density/Luminance vs Voltage (J-V-L) characteristics for Pe-LED device with B3PYMPM (green line circles) and TPBi (blue line stars). (d) Luminous efficiency (cd/A) vs luminance (cd/m2) and Luminous power efficiency (lm/W) vs luminance (cd/m2) characteristics for Pe-LED device with B3PYMPM (green line circles) and TPBi (blue line stars). The filled symbols correspond to luminous efficacy cd/A and open symbols correspond to lm/W.

