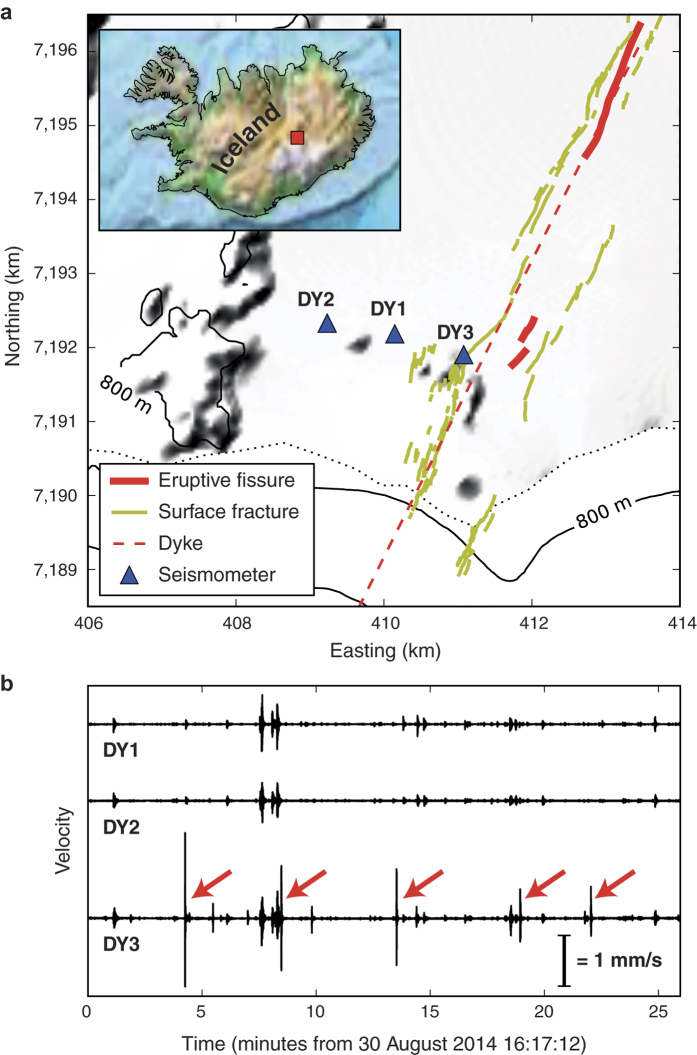
Figure 1. Overview of the seismic experiment and recorded data.
(a) Map of stations DY1, DY2 and DY3 (Guralp 6TD seismometers) installed north of the Vatnajökull glacier (white) on 30 August 2014 immediately adjacent to several large surface fractures; fractures (yellow) and eruptive fissures (red) mapped by Hjartardòttir et al.9; dyke location (red dashed) inferred by Sigmundsson et al.4; elevation data from National Land Survey of Iceland. Inset map shows the location within Iceland (plotted with Matplotlib Basemap Toolkit36 using the ETOPO1 model37). (b) Unfiltered vertical recordings on all three stations. Arrows mark the step events on DY3 investigated in this study. These events are not visible on stations DY1 and DY2.

