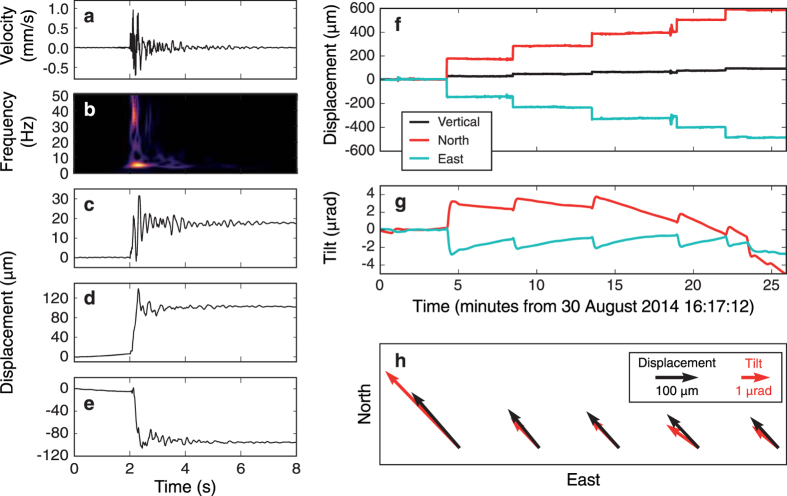
Figure 2.
Individual step event (a–e) and processed full-length seismograms showing ground deformation (f–h) at station DY3. (a) Vertical velocity waveform (instrument corrected). (b) Scalogram illustrating relative frequency content – the main frequency peak lies between 3 Hz and 8 Hz, with an additional peak above 25 Hz. (c–e) Vertical, North and East displacements, respectively; processed with the median filter method14. The resulting displacement step is about 17 μm upward and 123 μm in a northwest direction. (f) Median filter processed seismogram for step recovery (black: Vertical, red: North, cyan: East), showing a consistency of step direction for the individual events. Note that between events 3 and 4, a longer period event impedes the filter performance, leading to a slight artificial step. (g) Tilt record retrieved from seismograms using the tilt transfer function18. While the long-period trend is not interpreted here, each of the 5 events shows a clear tilt step on both horizontal components. (h) Directions and amplitudes of horizontal deformations of the 5 steps seen in (f,g).

