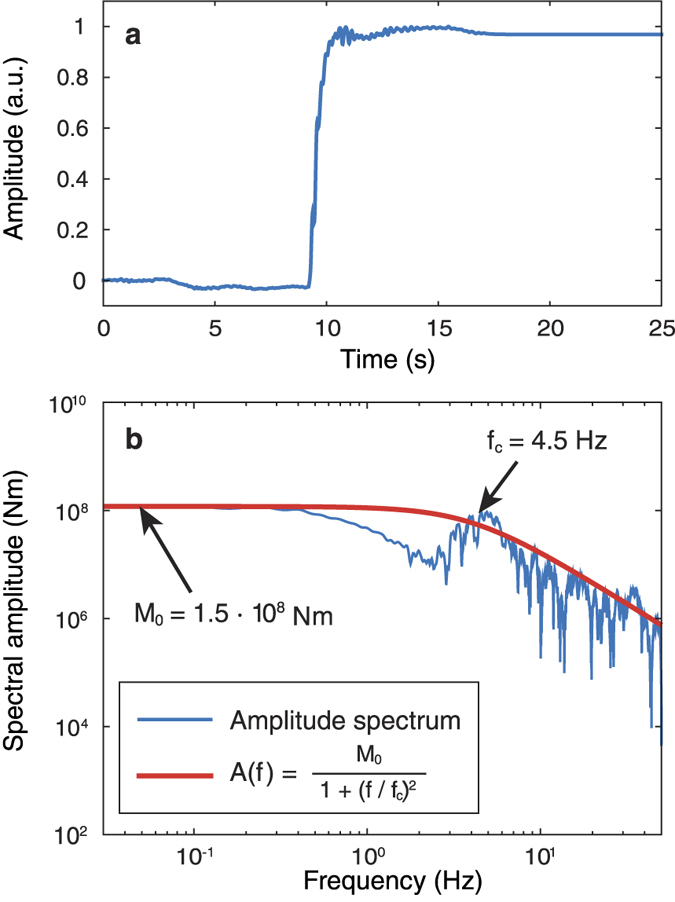
Figure 4. Source time-function and its amplitude spectrum.

(a) Normalised source-time history (slip on the fault). (b) Moment-rate spectrum fit with a ω2-source model28. The flat part of the spectrum (left arrow) corresponds to the seismic moment M0, while the corner frequency fc (right arrow) is related to the source size. The results shown are calculated for VP = 500 m/s and ν = 0.3 and the source location from Fig. 3b. Note that varying ν between 0.25 and 0.35 does not affect the corner frequency to a large extent (fc = 4.2–5.6 Hz).
