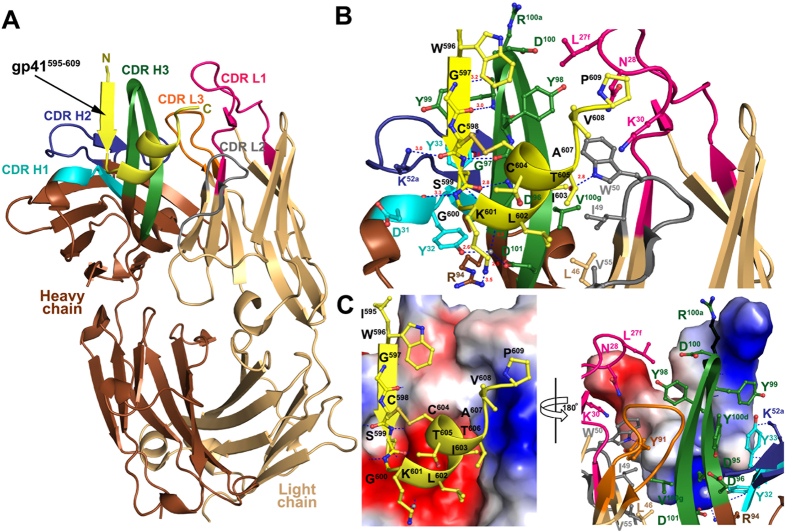
Figure 2. Crystal structure of F240 Fab-gp41583–618 complex.
(A) The ovell structure of F240 Fab-gp41583–618 complex shown in ribbon diagram. The light and heavy chains of F240 Fab are shown in light and dark brown, respectively, and the complementarity-determining regions (CDRs) are shown in magenta (CDR L1), grey (CDR L2), orange (CDR L3), cyan (CDR H1), blue (CDR H2), and green (CDR H3). The gp41583–618 peptide (residues 595–609 as defined by experimental electron densities) is shown in yellow. (B) F240- gp41583–618 complex interface. Residues involved in the interactions between F240 Fab and gp41583–618 peptide as defined by PISA are shown as sticks. H-bonds are shown as blue dashes and the CDRs are colored as in (A). (C) Electrostatic complementarity between the antigen binding site of F240 Fab and gp41583–618 peptide. The electrostatic potential is displayed on molecular surface of F240 Fab (left) and gp41583–618 peptide (right), which is colored red for acidic, blue for basic and white for apolar. Residues of Fab and peptide involved in the complex interface are shown as ball and sticks and colored as in (A).

